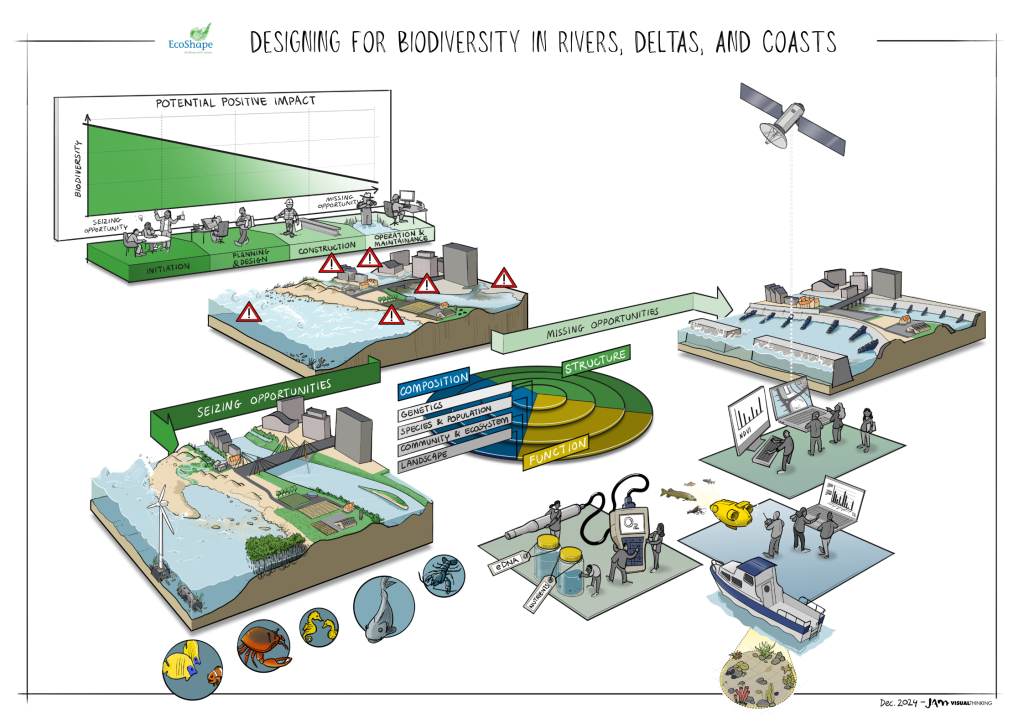
Designing for Biodiversity in Rivers, Deltas, and Coasts: Integration of biodiversity into infrastructure projects
A team of experts from EcoShape have collaborated to create a memo and infographic highlighting the importance of biodiversity in marine brackish and/or riverine infrastructure projects. The information and resources in this infographic are a helpful guide for the management and monitoring of biological diversity. Biodiversity is the variability among living organisms and are part ecosystems that are a dynamic interaction between living and nonliving environment.
To view the memo click here.
To emphasize the importance of the integration of biodiversity into marine brackish and/or riverine systems. Biodiversity is complex. This infographic provides comprehensive guidelines, methods, indicators, and tools on how to have a positive impact on biodiversity. Get to know your system ensuring the inclusion of local, regional and international policy and scientific literature. To help guide the integration of biodiversity by providing frameworks, guidelines, methods, indicators, and tools. Projects such as these necessitate a multidisciplinary team to promote the monitoring of biodiversity impacts by using linked indicators; and to provide a list of tools for the monitoring of biodiversity impacts through every phase of an infrastructure project.
To view the list of tools collected on biodiversity reports and framework please click here.
This infographic serves as a reference for the integration of biodiversity by protecting and enhancing it during the implementation of marine, brackish and/or riverine infrastructure projects with a gray component. These include operations such as dredging, construction, nourishments, and others. The IUCN Guidelines for planning and monitoring corporate biodiversity performance highlight 4 stages of corporate biodiversity performance: establishing priorities as to the significant pressures, species, habitats and ecosystem services (stage 1); developing ambitions, a vision, goals, objectives, actions and strategies for the inclusion of biodiversity (stage 2); determining indicators, core linked indicators, key performance indicators to monitor and report corporate biodiversity performance (stage 3); and the implementation of data collection, dashboards and map evaluation to enhance data-inclusive decision-making and lesson learning (stage 4; Stephenson & Carbone, 2021). The guidance in the infographic should help companies integrate data collection to monitor biodiversity impacts into their decision-making processes (stage 4) throughout all phases of their infrastructure projects. Further, the infographic focuses exclusively on direct biodiversity impacts (e.g., habitat removal due to dredging operations, emission of contaminants, etc.) and does not address indirect or supply chain impacts (Laboyrie et al., 2018). Consequently, activities by external parties, such as material suppliers or logistics providers, are beyond the scope.
As a follow-up to the infographic, our team created a two-pager that illustrates how infrastructure, when thoughtfully designed, can contribute to reversing biodiversity loss and increase the potential for positive impact. It emphasizes the importance of integrating biodiversity considerations early in project planning, transitioning from conventional grey infrastructure to nature-inclusive solutions, and continuously monitoring key indicators—such as species richness, habitat boundaries, and water quality—throughout the project lifecycle. These practices help ensure infrastructure supports resilient ecosystems and delivers biodiversity-positive outcomes.
To view the two-pager click here.
Resources

Miriam Schutter

Natasha Flores