Practical Applications
In this section we present a case-study in which we have applied a Monte Carlo simulation in combination with a socio-economic cost-benefit analysis to new developments around Lake Grevelingen in the Netherlands (Witteveen+Bos 2011).
Case: socio-economic cost-benefit analysis Lake Grevelingen
Lake Grevelingen is a former estuary, part of the Rhine/Meuse/Scheldt complex in the southwest of the Netherlands. Since the closure of the estuary by the Grevelingendam (1965) at the landward side and the Brouwersdam (1971) at the seaward side, and the construction of a saltwater inlet sluice (1978), it is the largest saltwater lake in Europe. In the meantime, Lake Grevelingen has developed into a valuable natural and recreational area of national and international significance. The lake is used for swimming, windsurfing, canoeing, diving, boating and fishing. Commercial fishing of lobster, eel and oyster is also an important function. However, the Brouwersdam has several side-effects, such as the ecological degradation of the lake. In order to counter these side-effects, the national government has started a feasibility study with the following objectives:
- Flood protection related to climate change;
- Improving water quality;
- Tidal Power Generation (renewable energy and innovation);
- Improvement of the regional economic structure (tourism, aquaculture);
- Restoration of tidal nature.
In the feasibility study 5 alternatives to reach these objectives were investigated. Here, we use the first alternative to show the applicability of the Monte Carlo Simulation. This alternative consists of the following measures (see figure):
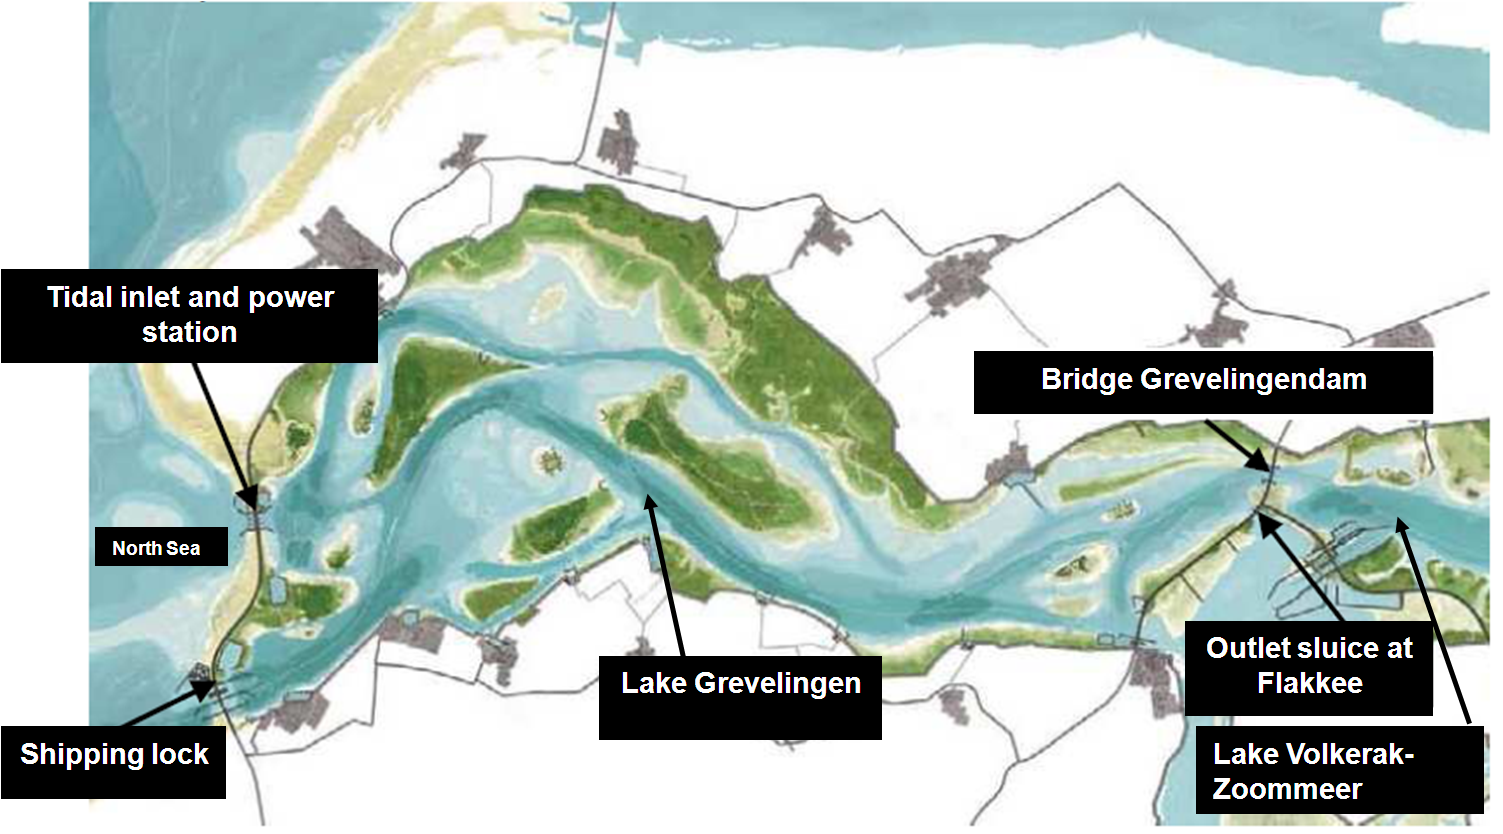
- The tide in Lake Grevelingen is reintroduced by making a connection to the North Sea by means of an inlet through the Brouwersdam.
- In this inlet a tidal power station is built to produce renewable energy.
- Lake Grevelingen is designed as a storage area for excess water from the rivers Rhine and Meuse. To enable this, an opening in the Grevelingendam between Lake Grevelingen and lake Volkerak-Zoommeer has to be made. In this alternative the opening in the Grevelingendam is designed as a bridge. As a result, the Volkerak-Zoommeer will become a salt water lake as well.
- A lock is built in the Brouwersdam in order to create a connection between lake Grevelingen and the North Sea for recreational vessels.
Results of the socio-economic cost-benefit analysis
The results of the socio-economic cost-benefit analysis are presented in the table below, a study completed in 2011 (Witteveen+Bos, 2012). Column 1 presents the results of the original alternative described above. The results show that alternative 1 has a negative net present value. In the sensitivity analysis, it was investigated whether it is possible to reduce the costs and to augment the benefits so as to obtain a positive balance. This was done via trial and error by changing the basic assumptions of the most important entries in the balance sheet:
- The investment and maintenance costs
- Energy yield
Cost reduction was obtained by changing the design of the turbines, the shipping lock in the Brouwersdam and the design of the opening in the Grevelingendam. It became clear that basic design assumptions strongly affect the investment costs.
Energy prices fluctuate considerably over the years. An important question was how much energy prices should go up so as to obtain a positive balance (break-even point). From this computation it became clear that energy prices should double from 0.06 euro/kWh to 0.12 euro/kWh in order to give alternative 1 a positive balance. Column 2 presents the results under the assumption that all design optimisations are effectuated, without increasing energy prices. The investments are much lower in this alternative because the original alternative was optimised and some other choices were made (Witteveen+Bos, 2011). Column 2 shows that in this case alternative 1 can get a positive balance. However, this is only the case if all design optimisations will be incorporated. It is not clear how realistic this assumption is. Therefore a Monte Carlo simulation is carried out to quantify the probability of obtaining a positive balance.
| Costs | original alternative 1 | optimized alternative 1 |
|---|---|---|
| Benefits | ||
| employment | 31 | 31 |
| energy yield | 226 | 139 |
| flood control (safety) | 188 | 188 |
| investments | 602 | 299 |
| knowledge and innovation | 10 | 10 |
| net present value (benefits – costs) | -113 | 131 |
| operation and maintenance | 100 | 54 |
| ratio (benefits/costs) | 0,84 | 1,37 |
| recreation | 7 | 7 |
| reduction of CO2-emissions | 34 | 16 |
| shell-fish fishery (mussels) | 91 | 91 |
| total benefits | 589 | 484 |
| total costs | 702 | 353 |
| water sports | 2 | 2 |
Monte Carlo simulation
For a Monte Carlo simulation it is necessary to have the probability distributions of the values used in the calculations for the SCBA. To limit the research effort we keep the smaller benefits fixed. Moreover, we assume that all probability distributions are normal. We only collect the parameters of the normal probability distributions for the costs and large benefits:
- Investment and maintenance costs;
- Flood protection benefits;
- Energy yield of the tidal power station;
- Profit of shell-fish (mussels) fisheries.
Investment and maintenance costs
In general the height of the project costs depends on many factors. For the case-study of Lake Grevelingen the total costs of the measures vary considerably between 702 and 353 million euro’s, depending mainly on the design of the structures. The maintenance costs are calculated as a fixed percentage of the realisation costs.
Flood protection benefits
The benefit of water storage on Lake Grevelingen is that investments for increasing dike height along the lower reaches of the debouching rivers can be cancelled or postponed. Here two types of uncertainty are considered:
- the moment when investments are necessary;
- uncertainty in cost estimates.
Uncertainty about the moment when flood protection measures are necessary depends mainly on uncertainty in expected future water level statistics in the rivers. The meteorological scenario applied shows an uncertainty in the water level forecasts of approximately 0.2 meters (DHV/HKV 2010). On average it takes approximately 30 years for a rise in water level of 0.2 meters. This is the combined effect of sea level rise and increase of river floods. This means that the moment at which the investment has to be made has an uncertainty range of 30 years (see table below).
The cost of increasing the height of dikes varies between EUR 5 million and EUR 10 million per km. In the Monte-Carlo simulation EUR 5 million and EUR 10 million are used as the 5% and 95% probability of exceedance, with a mean value of EUR 7,5 million (see table below).
Energy yield of the tidal power station
Here we consider two types of uncertainty:
- uncertainty in energy production;
- uncertainty in energy prices.
A hydraulic model was used to determine the energy production of the tidal power plant (Royal Haskoning 2010). This study gives some information about the bandwidth in energy production (see table below).
For the MC simulation, a justifiable assumption is -0,2% growth per year for the 5% probability of exceedance level, 4.5% growth per year for the 95% probability of exceedance level and an average of 1.5% per year (see table below).
Profit of shell-fish (mussels) fisheries
Bringing back the tide in Lake Grevelingen creates opportunities for mussel farming. Here three types of uncertainty related to mussels are considered:
• uncertainty in mussel production;
• uncertainty in mussel prices per kg.
In the cost benefit analysis it is assumed that the Grevelingen will produce 10,000 tons of mussels, taking production numbers of the Oosterschelde as a reference. Based on further analysis of mussel production (Deltares, 2010), 7,500 tons was taken as the mean value in the MC simulation; the above 10,000 tons as the 95% probability level, and 5,000 tons as the 5% probability of exceedance level (see table below).
There is a wide variation in the price of mussels. After analysis of various sources, in the MC simulation a 5% probability of exceedance level of EUR 0.25 per kilogram was assumed and a 95% probability of exceedance level of EUR 1.90 per kilogram, with an average of EUR 1.10 per kilogram (see table below).The type of probability distribution can differ for each uncertainty, but in this case no reliable information was available to select distributions other than the normal distribution.
Table 2: Valuation of uncertainties with 5% and 95% thresholds, and their mean values:
| Uncertainty | Type of distribution | Mean value | 5% probability of exceedance | 95% propability of exceedance |
|---|---|---|---|---|
| Mussel production (million kilogram of mussels) | Normal | 7,5 | 5 | 10 |
| Mussel price increase (% per year) | Skewed | 7% | 0% | 25% |
| Mussel price (euro per kg, price level of 2011) | Normal | 1,10 | 0,25 | 1,90 |
| Investment year for dikes with height surplus from 0,24 m to 0, 5 m | Normal | 2050 | 2035 | 2065 |
| Investment year for dikes with height surplus from 0,5 m to 0,74 m | Normal | 2070 | 2055 | 2085 |
| Energy production (GWh per year) | Normal | 193 | 183 | 203 |
| Energy price increase (% per year) | Skewed | 1,5% | -0,2% | 4,5% |
| Cost-savings increasing dikes (million euro/km dike) | Normal | 7,5 | 5 | 10 |
Results of the MC simulation
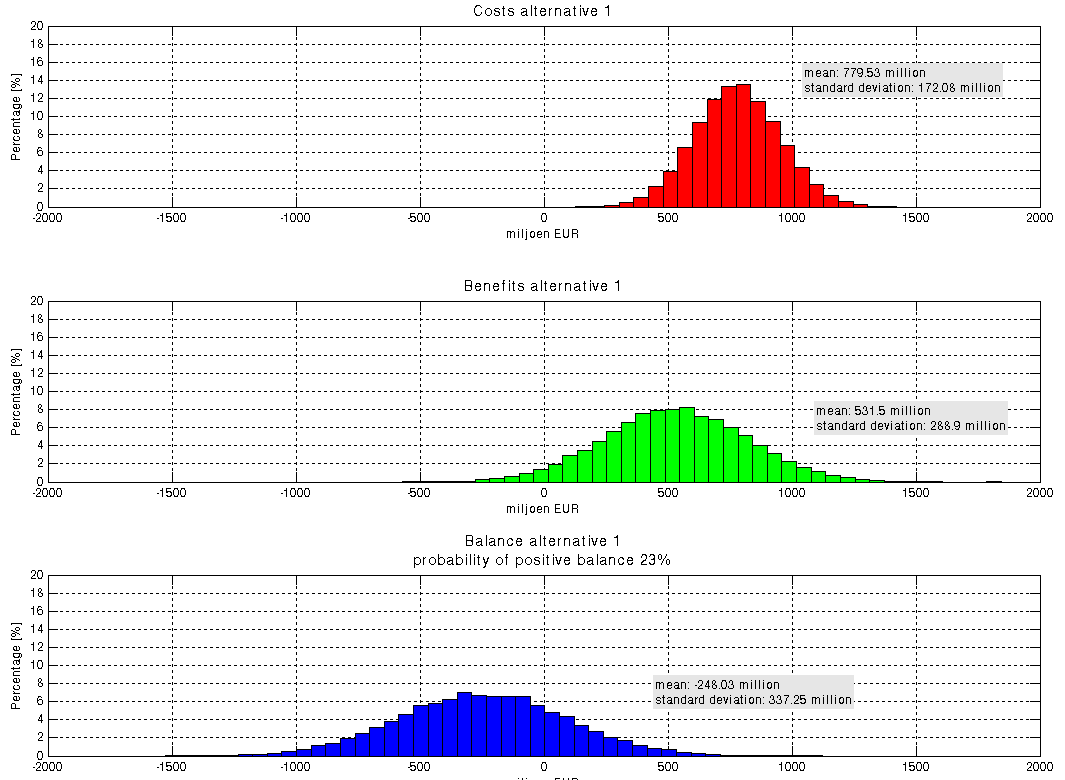
For alternative 1 an MC simulation consisting of 10.000 runs was performed. For each run, input variables were randomly drawn from the probability distributions of table 2. The figure on the right shows the MC simulation results for the total costs, the total benefits and the balance. The expected net present value is EUR -248 million and the standard deviation EUR 337 million. The probability of a positive balance is still 23%.
As can be seen in the figure, the benefits vary more than the costs. The factors contributing to the benefits are added and therefore the uncertainties of these contributions are directly translated into the balance (the same holds true for the costs). To reduce the uncertainties, it is in this case advisable to do more research on the benefits. If you want to know which factor contributes most to the total uncertainty, an extra MC can be performed. This extra analysis has not been done in this practical application.
Lessons learned
Effort and time: First conclusion is that performing a cost-benefit analysis with an MC simulation is not too complicated, but it is time consuming. The main difficulty is finding useful information for establishing the probability distributions. For different types of benefits, one can rely on available databases which include standard values for calculating the physical effect and the impacts on welfare (including prices). In most cases they include the mean values only. Data providing information on type and parameters of the most suitable probability distribution are often lacking.
Reducing uncertainties: The MC simulation yields useful information on which items in the balance sheet contribute most to the total uncertainty in the net present value. This information can be used to guide further research so as to reduce uncertainty.
Decision-making: An MC simulation should result in more comprehensive information about uncertainties and thus add to the decision-making process. It is true that an MC simulation leads to more information (see figure above): the graphs show additional information about the bandwidth of costs, benefits and the balance between them. Based on the MC-simulation it is also possible to give a prediction of the probability of a positive balance between benefits and costs. The question is whether this ‘new’ information is useful and workable to the decision maker. Reporting that there is a 23% chance of a positive balance can be very confusing to decision makers, especially if he thinks this is a completely random process.
Any advice to a decision maker should therefore give insight into the nature of the uncertainties in the study results presented. Decision makers on the other hand, should be well aware of possible financial setbacks or breaks. In general, it can be concluded that MC simulations positively contribute to the decision making process.