About
To assess the environmental impacts of human interventions, species indicators can be useful to evaluate the effects of different designs. The so-called Species Sensitivity Distribution (SSD) uses causal relationships between exposure level and effect level of individual species. By using exposure-effect data of multiple types of animals and plants, the sensitivity distribution of these species can be used to assess the risk of human interference more quantitatively. Although the SSD was originally developed to assess the ecological risk of toxicants, it also appeared to be applicable for non-toxic stressors. For instance, SSDs have been developed specifically for assessing the risk of suspended clay-particles and sedimentation for the environmental impact analysis of offshore oil and gas drilling activities. One advantage of having SSDs for non-toxic stressors is that they can be easily combined with those of toxic stressors, resulting in a single impact indicator – although such combinations remain to be fully validated.
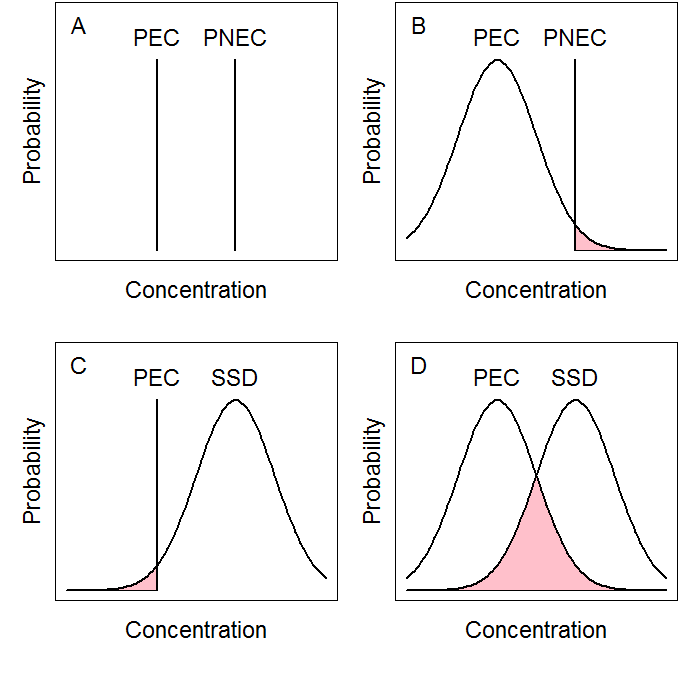
Eco-toxicological risk assessment often makes use of Predicted Environmental Concentrations (PECs), i.e. the concentration that is expected after human interference, and Predicted No Effect Concentrations (PNECs). PECs, are usually calculated with an appropriate model. The selection of such a model depends on the nature and source of the toxicant and the environmental system at hand. PNECs are usually based on lab studies and are often determined by applying an assessment factor to the most sensitive species (see box below). Traditionally, simply the ratio between PEC and PNEC is determined: a ratio larger than one indicates a potential ecological risk, whereas a value less than one indicates no risk . A disadvantage of this approach is that it doesn’t quantify the risk: when the PEC:PNEC ratio is larger than one, we know that there is a potential risk but we don’t know its magnitude. In other words, we expect that sensitive species are affected, but we don’t know which fraction of the community as a whole is at risk. Hence this approach is highly conservative, which can be a disadvantage.
There are four possible options for eco-toxicological risk assessment:
- Determine the ratio between the PEC and the PNEC.
- Take probability distribution of the PEC into account and determine the likelihood that the PEC exceeds the PNEC.
- Take the probability distribution of the species sensitivity into account and determine the fraction of species that is affected.
- Take the probability distributions of both the PEC and the species sensitivity into account.
Derivation of the PNEC
The PNEC is based on toxicological experiments with species in the laboratory, where the concentration-effect relationship for species is determined. PNECs are based on end-points (e.g., survival, growth, reproduction, etc.), which are usually measured in No Observable Effect Concentrations (NOECs) or the median lethal concentration (LC50). Traditionally, the PNEC is obtained by dividing the end-point of the most sensitive species tested in the lab by an assessment factor. This assessment factor is used to compensate for the uncertainty of lab to field, single to multi-species communities and other unknowns. This assessment factor is usually very large and depends on the amount and quality of data. It can range from 10 up to even 10.000 for marine species, where the highest factor is used when little information is available and smaller factors are used with increasing data availability. This approach focuses on information on the most sensitive species; information on other tested species is disregarded.
The SSD uses information on the sensitivity of all tested species (instead of only the most sensitive), by determining its statistical distribution. Of course, this is only possible if sufficient representative species have been tested. By using available information on all test species, SSD allows for the quantification of the ecological risk at a specific exposure level. This can be done by expressing the risk as the potentially affected fraction (PAF) of species. If the combined risk of multiple stressors needs to be assessed, the overall risk can be determined by superposition (total number of species affected by one or more stressors), resulting in a multi-stressor PAF (msPAF).
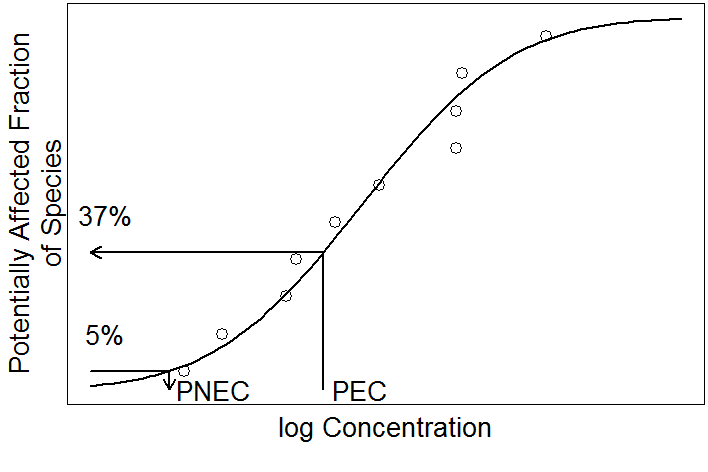
In an SSD, each marker represents the end-point of a toxicity test with a specific species, in other words: species sensitivity. The y-axis shows the cumulative probability distribution of species sensitivity, which can be interpreted as the PAF (37% in the presented example) at a certain exposure level. SSDs can be used in two ways: to derive ‘safe’ thresholds (PNECs), and to quantify the risk level at a specific PEC.
There are some important assumptions, on which both the SSD and the assessment factor approach rely:
- a sufficiently large number of species is used to construct the SSD;
- the selected species form a good representation of all species and ecological groups in the ecosystem;
- protecting individual species is good enough to protect the ecosystem. To strengthen this assumption, the use of exposure effect data of “ecosystem-relevant” or so called “keystone” species is recommended.
Although there are some well-known critiques (e.g., Forbes and Forbes, 1993; Forbes et al., 2001), the SSD approach (for toxicants) has been validated by several studies (e.g., Hose and Van den Brink, 2004; Selck et al., 2002; Van Wijngaarden et al., 2005). As indicated above, SSDs have originally been developed for risk assessment of toxicants. Only in recent years has the method been implemented to assess risk from non-toxic stressors. For toxic stressors laboratory test protocols are well defined and standardised, which reduces uncertainty in the risk calculations with SSDs. For non-toxic stressors, such standardisation is often not in place. This must lead to a higher uncertainty in the SSD risk calculations, but the extent to which this is the case remains to be investigated.
The SSD has shown to be a practical and useful tool in environmental risk assessment. It is a relatively straightforward approach which can report environmental impact by a single indicator and potentially allows integration of risks from multiple stressors. These properties are advantageous in environmental risk management.
Building with Nature interest
In BwN-projects, SSD can be used in various ways. In adaptive management, for instance, SSDs can be used to continuously evaluate the risk of human interference based on in situ data. SSDs can also be used to estimate the effects of different alternatives in advance (e.g. BwN concepts versus a traditional approach), via exposure effect relations for relevant stressors. For the latter, they have to be used in combination with tools that estimate environmental exposure levels (PECs). SSDs are therefore relevant for BwN phases ranging from design to (adaptive) construction management.