Operation and Maintenance
In the first year after completion, the ownership of the land was handed over by Defra to local authorities and the Royal Society for the Protection of Birds (RSPB). In the wetlands first signs of results were found, such as bird, wildlife and wetland vegetation. The expectations are that the wetlands need at least 5 years to mature and to get all the expected flora and fauna. During these 5 years the wetlands will be monitored closely and the interesting lessons learned will be shared with the public.
The initial monitoring is still ongoing, and the full results remain to be reported. However, from the interim progress reports that have been produced by ABPmer and Jacobs up to the end of 2010 (i.e. up to four years after the breaching), the following general observations can be made:
Breaches and channels
The breaches and channels through them are very stable which confirms the effectiveness of the approaches underlying their design.
Accretion
Within the site, sediment accretion has occurred relatively consistently and evenly due to the slow flows and stable internal creek/channel configurations. In the first year after breaching (2006 to 2007), accretion was around 10 cm (of which about 50% is considered internally relocated materials and 50% externally imported sediments). In each subsequent year, annual accretion assumed to consist predominantly of imported sediments amounted to 3 to 5 cm on average (specifically 5 cm in both 2008 and 2009, and 3 cm in 2010).
Invertebrates
The accretion and the relatively stable and depositional nature of the environment has helped to promote rapid benthic invertebrate colonization of the mudflat (about 80 ha in extent). After the first, year invertebrates abundance was at 20,000 organisms/m2 and has ranged between 10,000 and 20,000 organisms/m 2 in each successive year. The benthic assemblages have been dominated by large numbers of mud snail (Hydrobia ulvae) and although the patterns of organism recruitment are clearly complex and variable, there is evidence that the assemblages are maturing over time. One indication is the increase of bivalve species over time (representing 2%, 4%, 14% and 26% of the populations in each successive year).
Birds
The bird monitoring (by CJT Ecology) shows that in the first four years of the monitoring programme the site has been supporting very good numbers of waterbirds. This was already the case in the first winter survey (2006/07) when the site supported around 7,000 waterbirds and included good numbers (i.e relatively high in a national or international context) of many key species such as Shelduck, Dunlin, Black-tailed Godwit, Ringed Plover and Golden Plover. In the following two winters the value of the site continued to grow as the abundance of waterbirds increased to around 10,000 and then 12,000. In the winter of 2008-2010 the overall abundance levels declined slightly. These overall trends are strongly influenced by some major inter-annual changes in the abundance of certain species which, in turn, are likely to be influenced by the weather conditions.
In 2009/10, for instance, particularly bad weather conditions were experienced as compared with other years. Moreover a range of other factors influence the natural variability of bird populations (e.g. breeding success, timing of migrations, national population trends and inter-annual or inter-generational changes in roosting/feeding site selection).
It is worth noting however, that the numbers of birds using the site as a roost reduced in 2009/10, whereas the number of birds feeding increased. This may indicate that the habitat and the relationship with migratory birds are still developing and maturing, or that under adverse weather conditions the site’s feeding and roosting functions exhibit opposite trends.
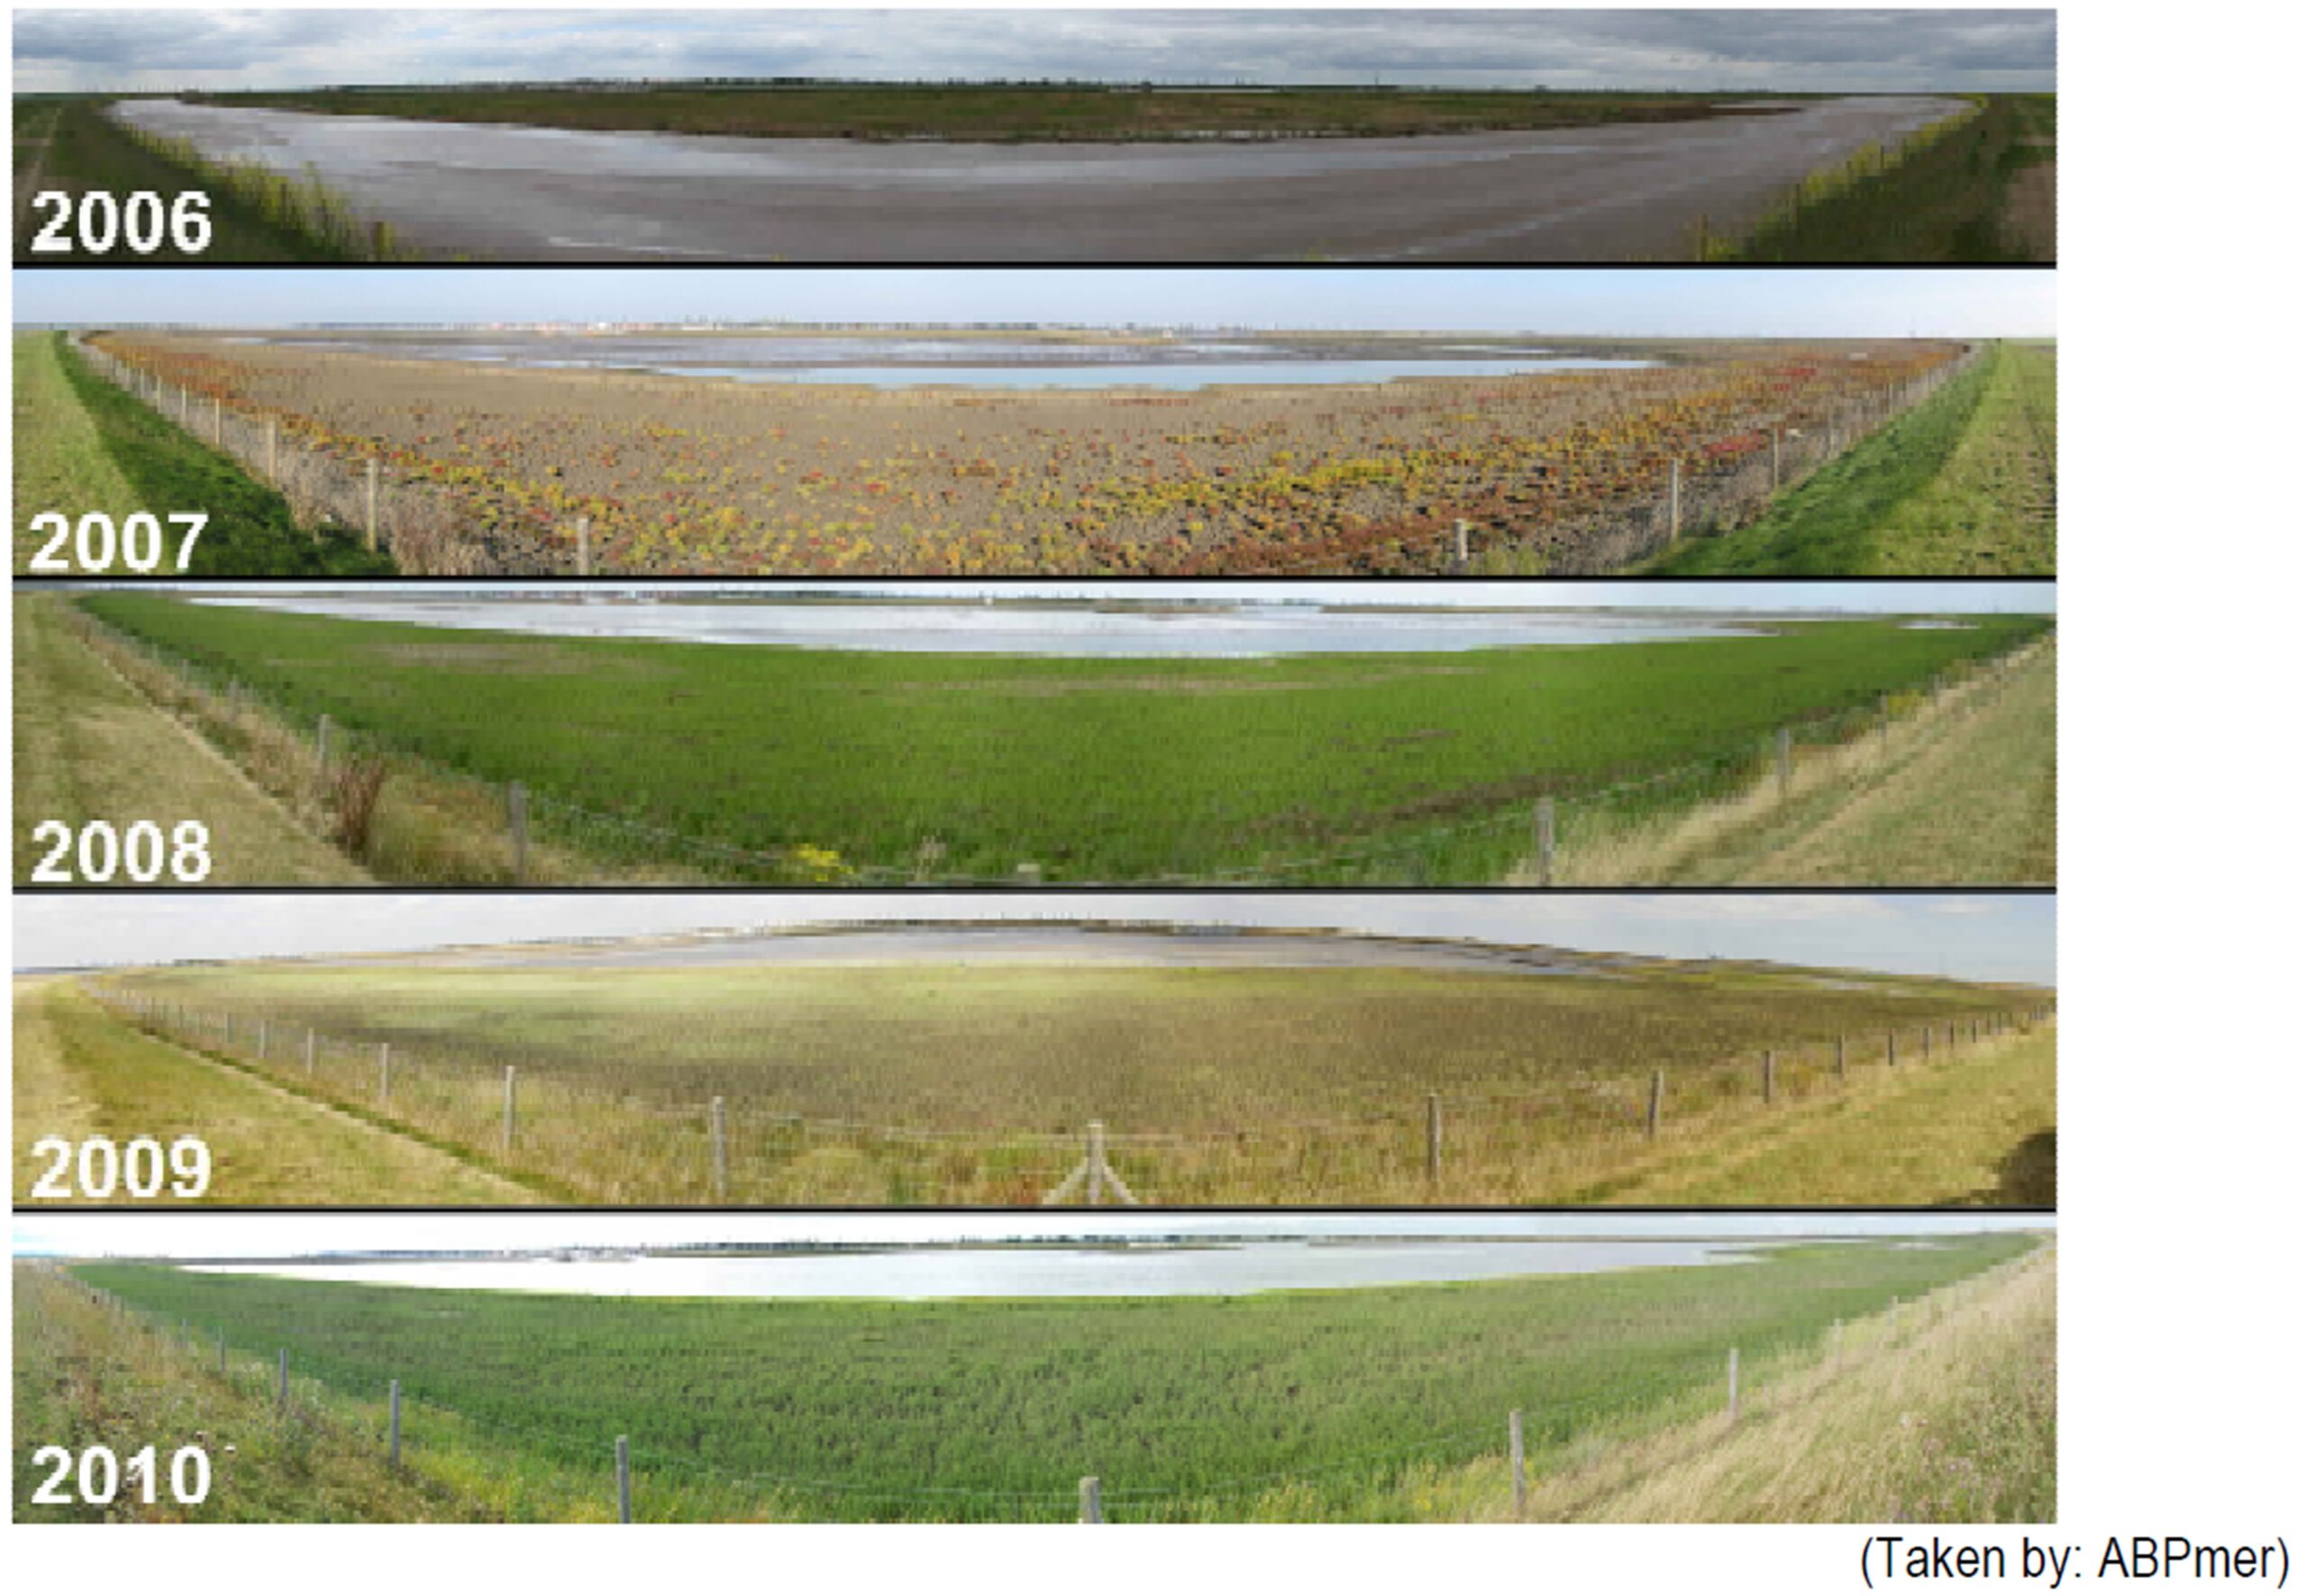
Saltmarsh
Saltmarsh coverage of elevated areas of the sites (approx 25 ha in extent) has occurred relatively rapidly. On average plant coverage (i.e the amount of marsh plant compared to bare mud at any given location) has rapidly increased from less than 1% in 2007 via 6% in 2008 and 60% in 2009 to ultimately near 100% in 2010.