Case Study Results
This section describes the results of the demonstration case: the probabilistic methodology is worked out for the effects of a fictitious dredging project on a population of Sandwich Terns.
The impact of two different dredging scenarios is considered:
- Far field effects of large dredging project, which takes several years and;
- Far field effects of a (relatively) small, short duration dredging project.
Two different approaches to the fish capture rate are elaborated:
- the conservative approach, assuming such a capture rate at optimal conditions, that any decrease of the capture rate leads to a lower breeding success;
- the empirical approach, estimating the capture rate at optimal conditions from measurements. (If sufficient data are available, a probability density function of the capture rate at optimal conditions can be estimated. In this case, implicitly also the natural variation of prey availability can be taken into account).
Conservative approach
The capture rate at optimal conditions is estimated at 8 fishes per day provided to the chicks. Any decrease of this number would directly lead to a decrease of the breeding success. Subsequently, the input variables of the population dynamical model are adjusted in such a way that the tern population in the reference situation is constant (on average).
For dredging scenario 1, the impact on the number of breeding pairs was modelled for a range of background turbidity in the fictitious foraging area (van Kruchten & van der Hammen, 2011). The different probability density functions of SPM- and chlorophyll-a concentrations and the set of input variables for the different model runs are provided by van Kruchten & van der Hammen (2011). The figure shows the probability (y-axis) that the impact that will occur in reality is less (more positive value) than the possible impact X at the x-axis. A negative value at the x-axis means a decrease of the population size. For example: the results for C1 (the scenario with the highest average SPM concentration,23.0 mg/l ) show that the probability is 81% that the decrease of the number of breeding pairs will be less than 20%. Consequently, the probability of occurrence of a decrease of 20% or larger is 19%. For C4 (the scenario with the lowest average SPM concentration, 9.3 mg/l) the probability of occurrence of a decrease of 20% or more is close to zero.
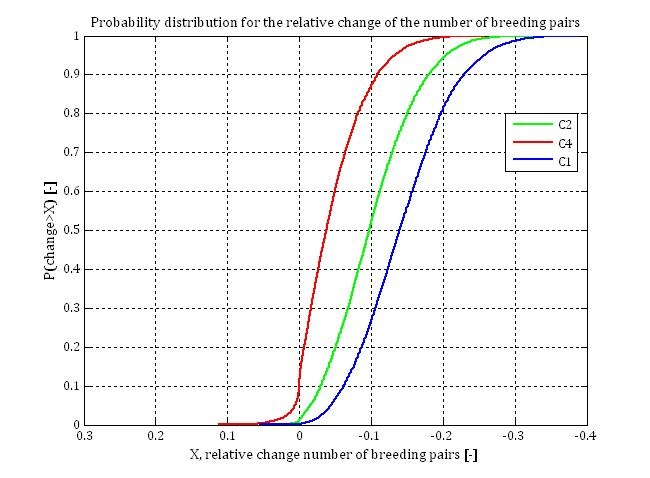
As expected, the impact of dredging is larger at a foraging area with higher background turbidity. While the average Secchi disk transparency is 1.0 m in area C1, it is 1.9 m in area C4. At a transparency of 1 m, an increase of turbidity leads to a stronger decrease of capture probabilities than at a transparency of 1.9 m.
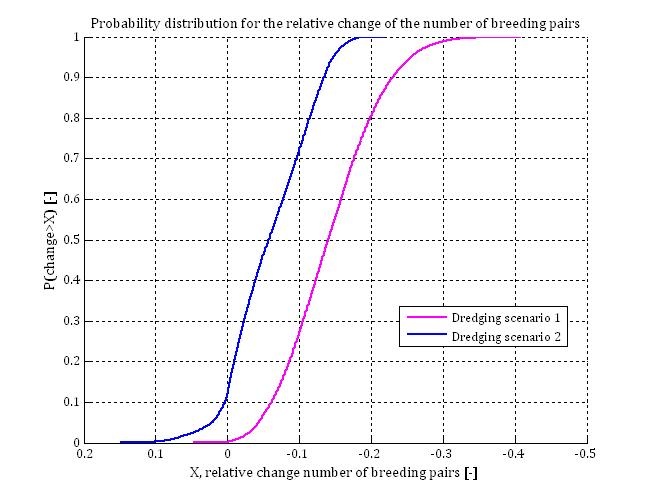
In addition, the impact of dredging scenario 2 on the number of breeding terns has been modelled by using the conservative approach. The figures below compare the results of dredging scenario 1 (pink line) and dredging scenario 2 (blue line); probability distribution for the relative change of the number of breeding pairs for background turbidity like C1 (top figure below) and C4 (bottom figure below) (van Kruchten & van der Hammen, 2011).
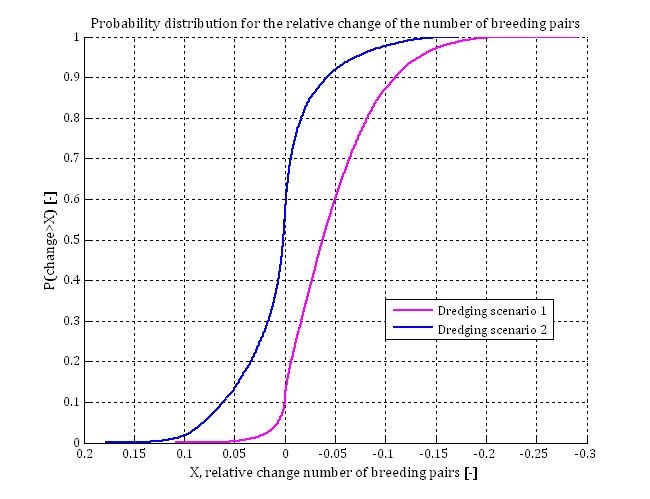
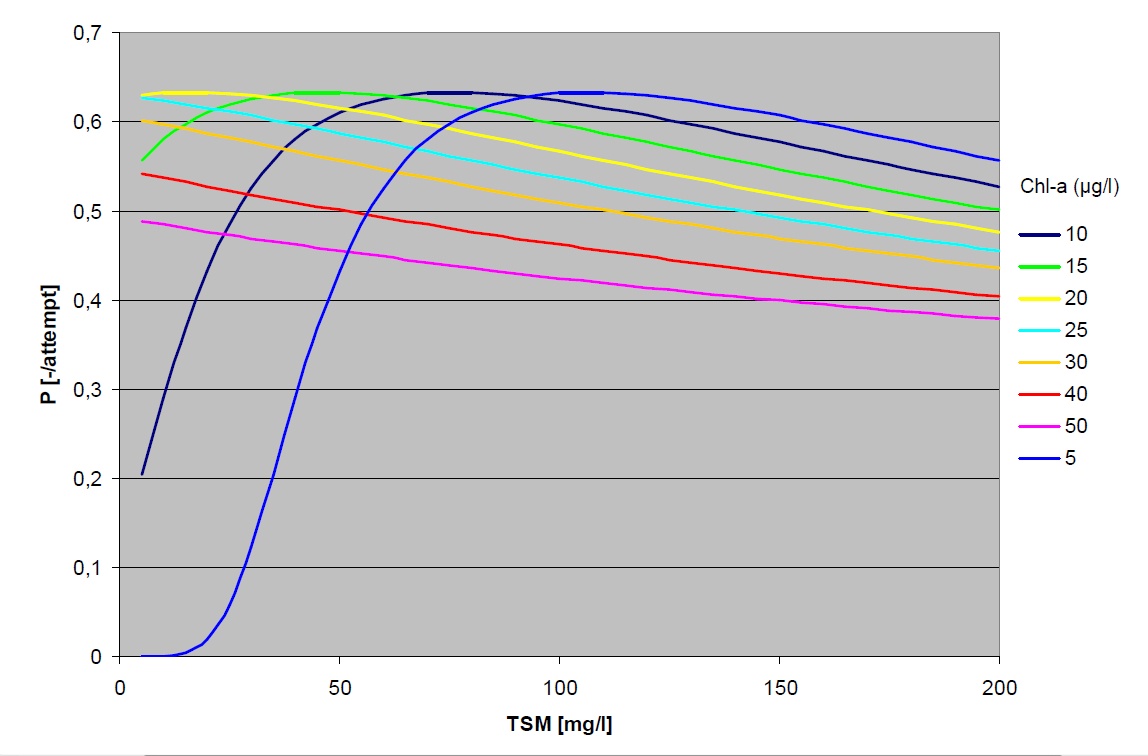
The results of dredging scenario 2 at low background turbidity (9.3 mg/l) show a relatively large probability of positive effects. This can be explained by the low background turbidity and the short period over which turbidity is increased by the dredging activities. On average the background turbidity (location C4) is lower than the optimal turbidity; the water is mostly too clear for optimal foraging conditions. If this is the case, an increase of silt concentration has a positive effect on the catchability of prey (see figure below for TSM-concentrations < 20 mg/l and Chl-a concentrations < 20 μg, based on the equations of Suijlen & Duin (2000), Visser (1970) and Baptist & Leopold (2010), (van Kruchten & van der Hammen, 2011)). Only in years in which silt- and chlorophyll-a concentrations are substantially above average, an increase of turbidity due to dredging activities can have a negative effect on catchability. The probability that such background turbidity conditions (extreme for C4) occur simultaneously with the impact of the dredging, which is only noticeable during two years in scenario 2, is quite low. This explains why the probability of occurrence of positive effects is relatively large for this specific case.
Capture rates based on measurements
As long as no observations on capture rates or the amount of provided food are available for the possibly affected tern population, the precautionary principle requires using the conservative approach. In the present subsection the impact on tern populations has been modelled as if measurements of capture rates were available.
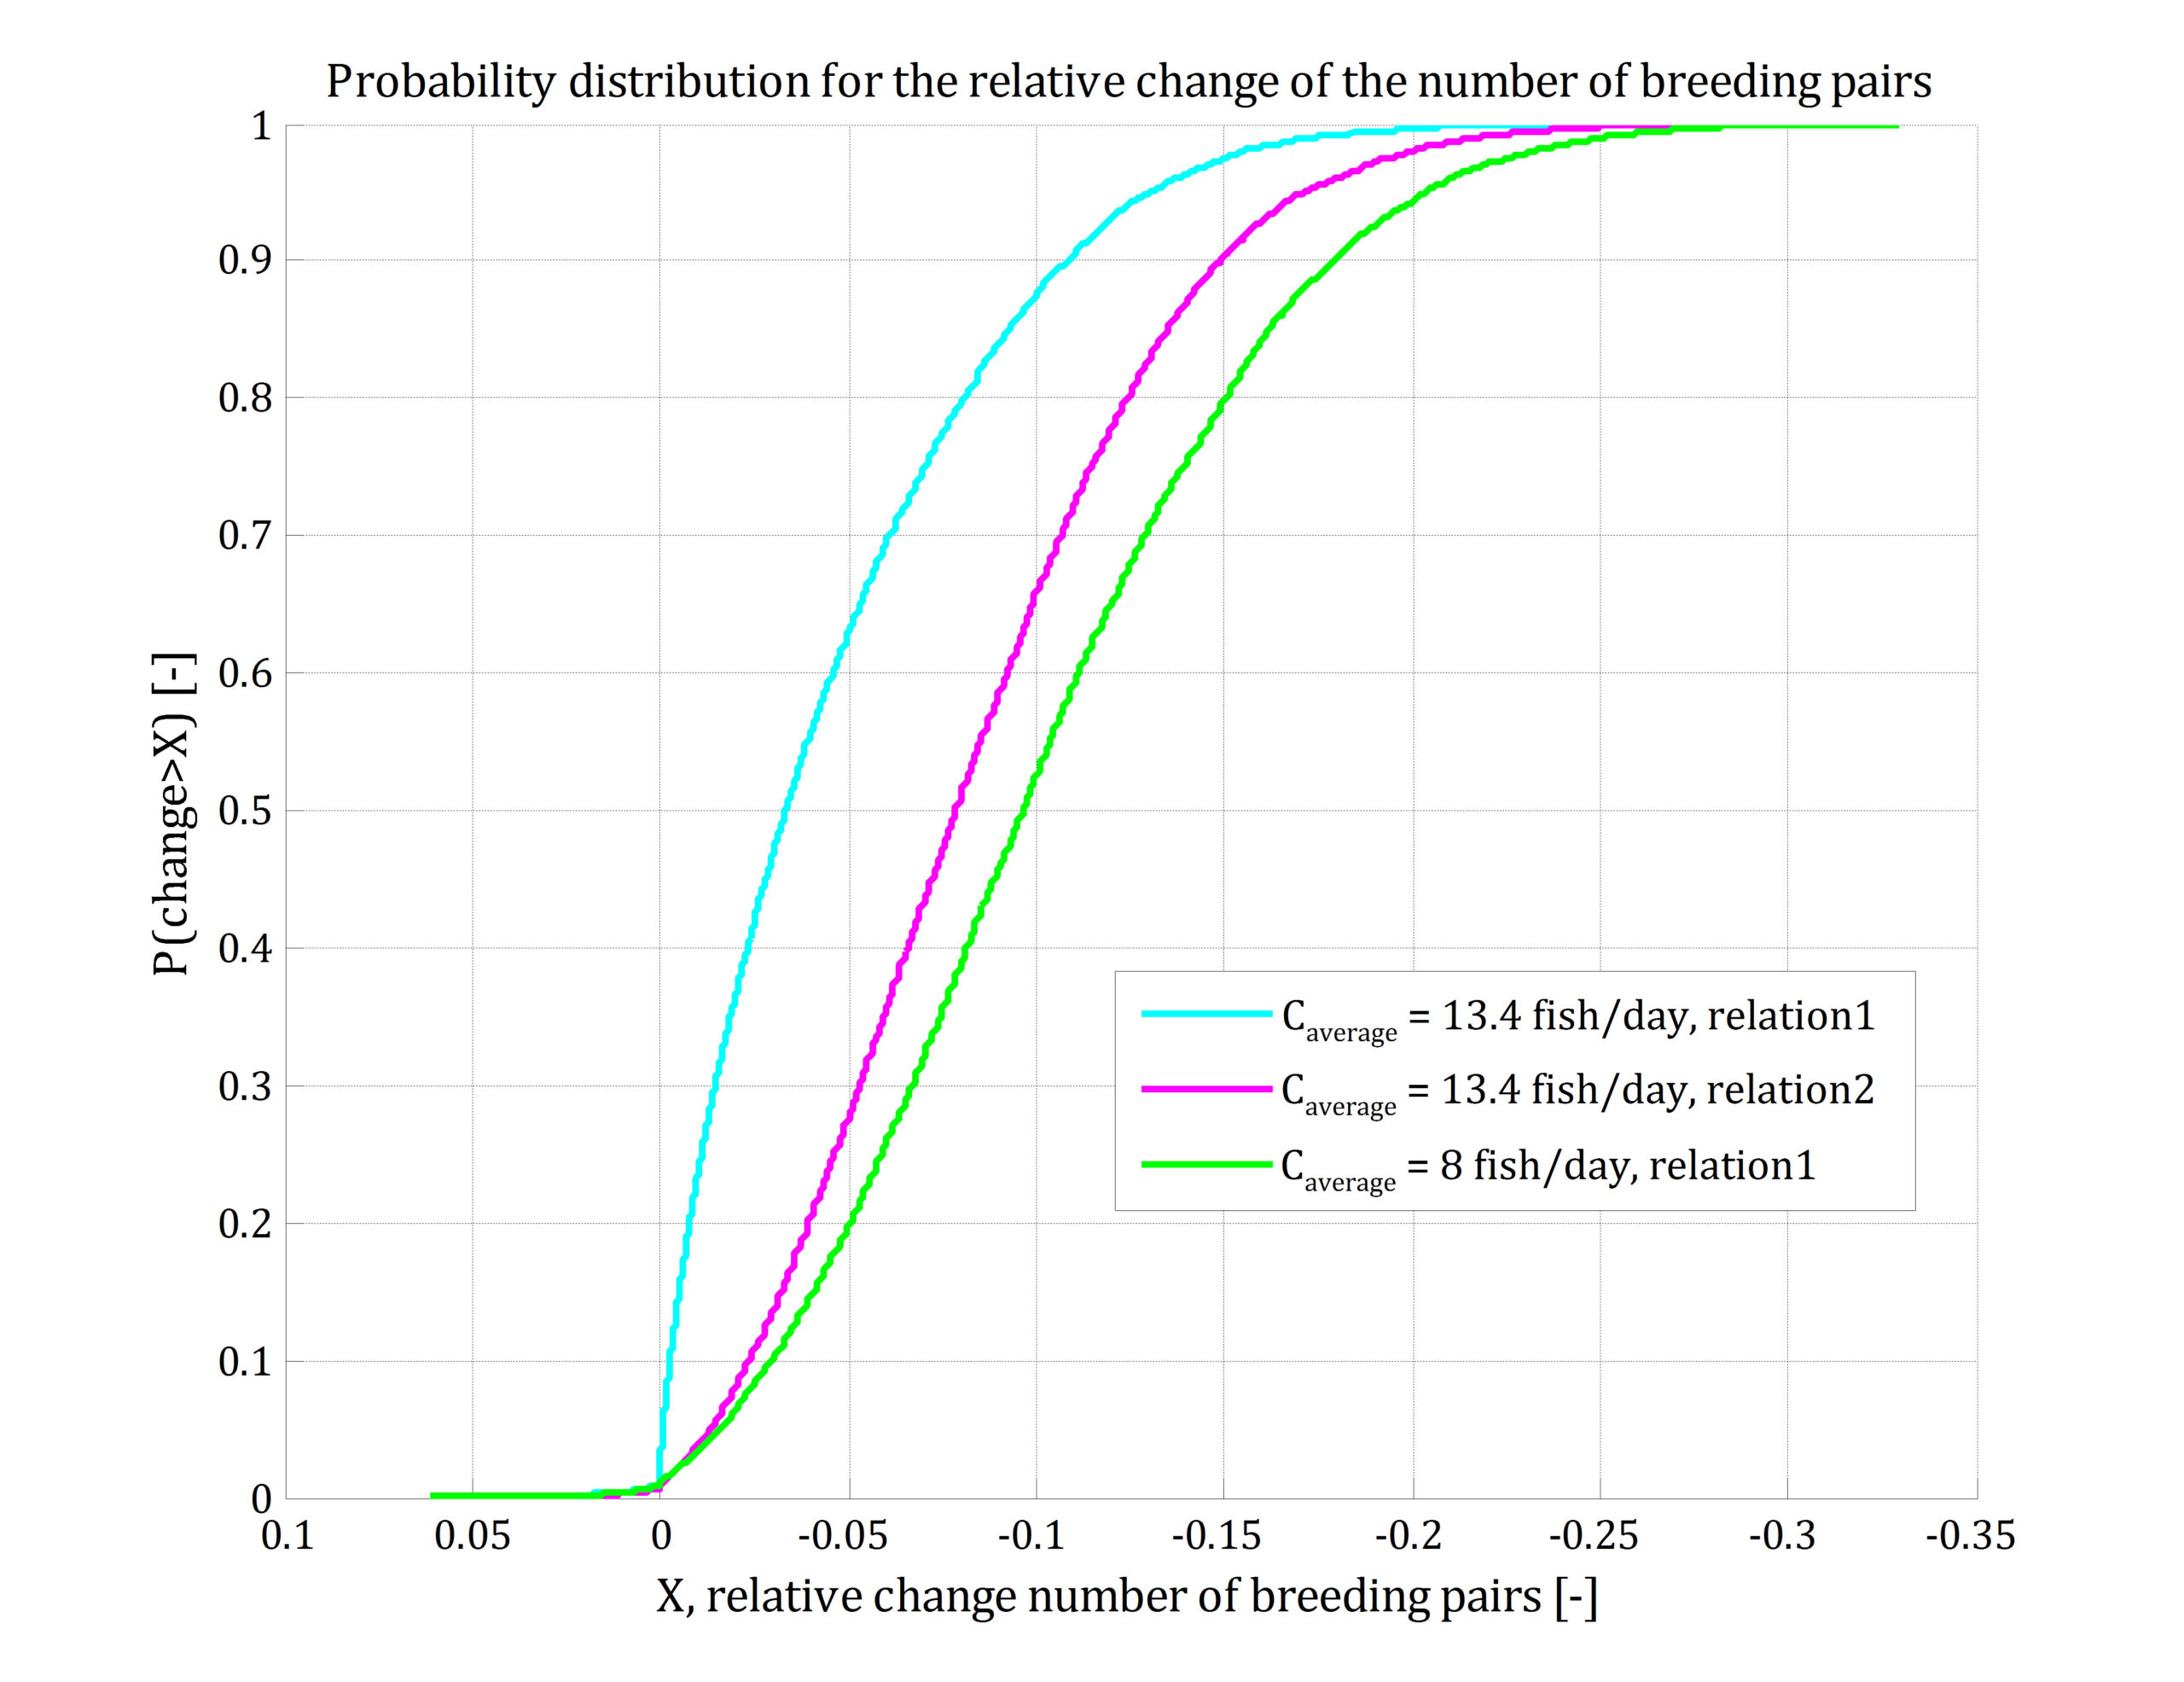
Stienen & Brenninkmeijer (1998) observed that on average 13.4 fishes were provided to the nest per day. The optimal capture rate was adjusted to such a value that for dredging scenario 1 and background turbidity like C2 (16.3 mg/l), the average number of fishes provided was 13.4 per day. The figure above shows the probability distributions for the relative change of the number of breeding pairs under those conditions (dredging scenario 1, background turbidity like C2 (16.3 mg/l)) (van Kruchten & van der Hammen, 2011). The figure also shows the influence of the uncertain parameter values of the relation between food provided and breeding success; where relation 1 differs in parameter setting from relation 2.
Alternative presentation of the impact of dredging
In previous subsections the impact of dredging on tern populations was defined as the relative decrease of the number of breeding pairs, compared to the number of breeding pairs in the reference situation (without dredging).
Also in the reference scenario a decrease of the number of breeding terns is possible. The results of van Kruchten & van der Hammen (2011) show that the probability that the population size will decrease autonomously over a period of 35 years is about 50% . As a consequence of dredging activities (increasing turbidity) the probability distribution for the population development will change (e.g. chance that the population will decrease autonomously becomes larger than 50%). The Secchi disk transparency in the reference situation was 1.34 m on average. If the transparency decreases for two successive feeding periods (year 1 and 2) to (constantly) 1 m, this hardly changes the probability distribution for the population development over 35 years. In case of a Secchi disk transparency of 0.8 m, the probability on a decrease of the population increases significantly, compared to the probability in the reference situation.