Modelling the cause effect chain
The cause-effect chain for the impact of dredging activities on tern populations contains several uncertain and variable factors. As these uncertainties may have a significant influence on the ultimate impact, a probabilistic model approach is taken. First, the relationships between the different elements in the cause-effect chain are made quantitative (see sections below). The resulting chain of equations was used in a Monte Carlo analysis, simulating the impact of dredging on the tern populations a large number of times (e.g. 1000 times), each time with a different selection of the stochastic inputs. This analysis results in a probability distribution of the change in population size due to the dredging activities. The following sections describe the relationships between the different elements in the cause-effect chain.
From sand extraction to water transparency
Water transparency is mainly influenced by the fine sediment that is released by the dredging activities, the background concentration of suspended particulate matter (SPM) and the concentration of phytoplankton. To model the impact on tern populations, the increase of the SPM-concentration during the feeding period of tern chicks within the foraging area of the tern population is relevant.
Background SPM-concentrations and phytoplankton concentrations show large fluctuations, caused mainly by changing weather conditions. Because of these fluctuations, the SPM and phytoplankton concentrations are taken as stochastic inputs to the model.
From total suspended matter to water transparency
Advanced numerical models can be used for modelling the reduction of the water transparency by sand mining activities and phytoplankton concentrations. In the present demonstration case, however, the following simple empirical relation is used (Suijlen & Duin, 2001), assuming light transparency to be a good measure for visibility:
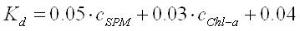
with
K d = light attenuation coefficient (m -1 )
c SPM = concentration of suspended particulate matter (g/m 3 )
c Chl-a= concentration of Chlorophyll-a (μg/m 3 )
Water clarity, or visibility, is usually measured with a Secchi disk. The following empirical relation for the southern North Sea, determined by Visser in 1970, is used to convert the light attenuation coefficient K d to the Secchi disk transparency S (Baptist & Leopold, 2010):

with
S = Secchi disk transparency (m)
From water transparency to hunting efficiency
Turbidity is expected to reduce the number of prey fishes per unit time that can be caught by terns, which in its turn is a function of the ‘findability’ of the prey fish and the capture efficiency of a hunting Tern. Baptist & Leopold (2010) studied prey capture probability as a function of water transparency for foraging Sandwich Terns. Prey capture probability is defined as the probability that an attempt to catch a fish succeeds. A logistic optimum curve shows the relationship between transparency and prey capture probability:
In this figure, the solid line presents the results of the logistic regression, the dotted line gives the 95% confidence interval. The histograms on the top and bottom respectively give the number of caught prey and missed prey and the dots give the average probability for each histogram class (Baptist & Leopold, 2010).
‘Findability’ of prey
Unfortunately no information is available on the relation between turbidity and ‘searching-time’. It seems reasonable to assume, however, that searching-time increases with increasing turbidity. The relative increase of the searching-time is assumed to equal the relative increase of the number of prey capturing attempts.
Number of prey that can be caught per day
The relative increase of the number of attempts and the searching time is necessary for estimating the number of fishes that can be fed to the chicks. For estimating this number the following additional information is necessary (also see Van Kruchten & van der Hammen, 2011):
- The number of fishes that can be caught under optimal transparency conditions. Three options were used: 1) worst case approach: assuming that the amount of fish that can be caught per day at optimal conditions is exactly the number of fishes that is necessary for the adult terns, plus the number that is necessary for feeding the chicks in order to achieve an optimal breeding success; 2) conservative approach: assuming such a capture rate at optimal conditions, that any decrease of the capture rate leads to a lower breeding success; 3) empirical approach: estimating the capture rate at optimal conditions from measurements.
- The amount of fish adult terns need for food per day. This depends the time terns spend flying per day, the digestibility of fish, the energy content of fish, the average fish mass and the Basal Metabolic Rate (BMR). Based on available literature it was calculated that each adult has to catch 43 fishes per day (see van Kruchten & van der Hammen, 2011). This number is based on: an average mass of 4 g per fish; 33 fishes per day for adult consumption; and 10 fishes per day per adult for the chicks (of which 30% gets lost, so 14 fishes are fed to the chicks per day (7 per adult)).
- How much time per day is available for foraging. For a population that breeds at a distance of, for example, 7.5 km from the foraging area, it would mean that less than 8 hours can be spent to foraging.
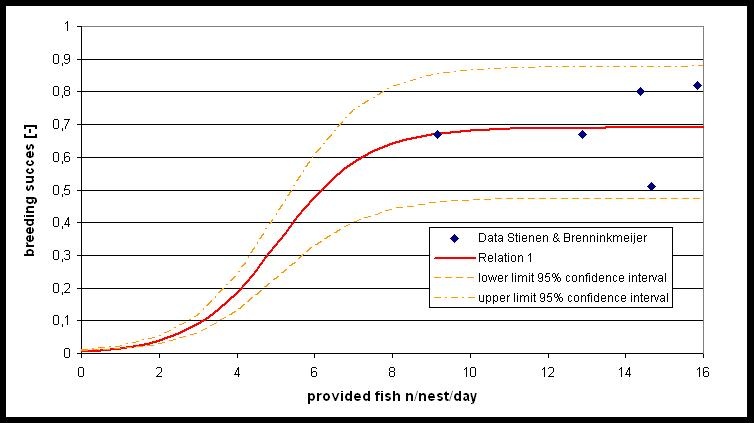
From amount of food brought to the nest to breeding success
Although food conditions are often suggested as a limiting factor for breeding success, a clear relation between breeding success and the amount of food provided has not yet been found. Stienen & Brenninkmeijer (1998) measured the breeding success and the amount of food provided. This data was used to derive the relation between provided number of fishes and breeding success. Further research is needed on the breeding success if during short periods of time hardly any food is provided to the chicks.
Population dynamical model
A decrease of the breeding success of terns is expected to result in a decrease of the population size. A method for modelling this change of the population size is the Leslie-matrix, which is a discrete, age-structured model for population ecology. For an explanation of this method is referred to Van Boven & Schobben (1993). They developed a population-dynamical model for the Sandwich Tern in the Netherlands. The values of the survival rates were adjusted in this case in such a way that on average a constant population size is modelled by the Leslie-matrix. There are no clear indications that the survival or reproduction rates of terns in the Netherlands be influenced by the population density. Because of this, no density-dependent effects are incorporated in the Leslie-Matrix.