How to Use
The module is constructed in MATLAB. The output of the tool is a file type that can be imported in a hydrodynamic model, like Delft3D, to describe the roughness height in the different cells. It is recommended that users acquire a basic understanding of the implemented formulations prior to use.
Input of the module
- Bathymetry
- Location of the roughness elements present in the area
- Hydrodynamics
After starting the module, a map with the bathymetry of the area is plotted. The map is restricted by a lower limit of -2 m NAP, which is the lower limit of the dry area during the ebb period. This limit can be adjusted to the specified area. Areas below this limit are filled dark blue.
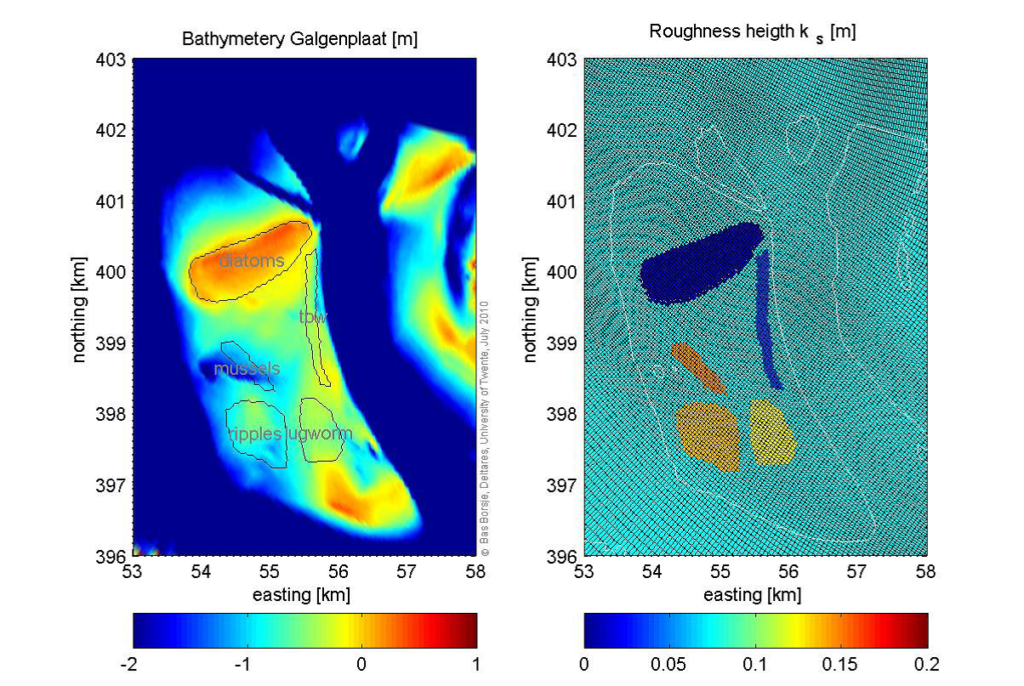
Next, the user is asked to manually click a polygon of the chosen roughness element onto the bathymetry map. The polygon is closed by clicking on the first node again (the cursor will change in a circle to close the polygon). After the first polygon is filled, all other roughness elements have to be defined in the same way. After defining the last roughness element (sand ripples) and overview map is given (adjacent figure). This overview shows in the left frame the bathymetry of the area (in this case the Galgeplaat) in m NAP and in the right frame the roughness height ks in m on the hydrodynamic grid.
The output of the module is a .rgh file, which can be used in the hydrodynamic model (e.g. Delft3D) calculation to prescribe the roughness height at the different cells. The default roughness height (ks = 0.075) is used for the cells where no polygons are defined.