Practical Applications
To demonstrate the potential of the OpenEarth approach we discuss the Holland Coast case. This case develops alternative strategies for the sustainable development of the Dutch coast from Hoek van Holland up to Den Helder, over a timescale of 50 to 100 years. It deals with a range of possible measures, both for sand mining and coastal interventions, addressing (1) the wide range of possible approaches to enhancing the natural potential of a site or design and (2) alternative methods to work with natural processes rather than against them. (Van Koningsveld et al., 2010)
Holland Coast case
The Netherlands is well-known for its advanced coastal protection policies and in association a lot of projects have dealt with this particular stretch of coast before. Invariably each of these projects always dealt with (subsets of) Rijkswaterstaat’s datasets on bathymetry (transects as well as grids), hydrodynamics (waves, currents and waterlevels) and water quality (TSS, etc), TNO’s datasets on topography (the general elevation data of the Netherlands), bathymetry (Dutch continental shelf bathymetry) and soil composition (soil types and grain size distributions), and KNMI’s datasets on meteorology (wind and pressure fields).
All these datasets are now available through OpenEarth in readily accessible uniform netCDF files. The datasets are stored in raw form in the OpenEarthRawdata repository. The same repository also contains the Matlab and Python scripts that can process these data into netCDF files. The raw data have been enriched with meta information and transformed to netCDF. These files are stored on an OPeNDAP server. This server allows everyone to make calculations with these data without the need to download the full data collection that covers over 10 GB.
Finally, for non-specialists that do not need to perform calculations, all data are also presented as readily processed KML feeds for straightforward visualization on Google Earth. Because all this data is already available, the Holland Coast case needs to reserve less of its budget for gathering and processing of historic external datasets. As a result more budget remains for additional data acquisition and/or more detailed (data) analysis and reporting. Just as the Holland Coast case benefits from all this previously gathered data, any future project will benefit from the additional data gathered specifically by this project and new or improved tools for data analysis.
Availability of important basic analysis tools
Besides the use of various datasets a number of important coastal state indicators is associated with the coastal policies that apply to this coastal region.The decision recipe for this policy is based on a volume trend approach applying the Momentane Coastline (MCL) concept. This concept is used in a maintenance indicator comparing the extrapolated expected coastline position (TCL) with a reference value: the 1990 coastline position (BCL) (TAW, 1995; Van Koningsveld and Mulder, 2004).
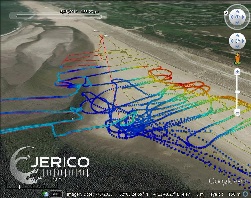
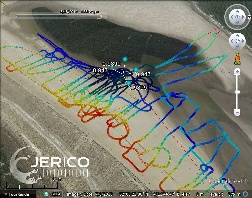
Since well tested tools associated with important indicators are already available from the OpenEarthTools repository, the Holland Coast case needs to reserve less of its budget for tool development. As a result, more budget remains for thorough application of these tools to the also available datasets. The availability and accessibility of data and tools in this case challenges the analyst to apply his/her analysis routines not to just one transect or a couple of transects near the area of interest, but simply to all transects available in the database. This is an excellent way to (1) see whether or not the routine is robust enough to deal with variations/flaws in the data, and (2) to see whether an observed phenomenon can be detected throughout the dataset or just in a small sub selection of the data. Currently the Building with Nature consortium is executing a field campaign at Vluchtenburg, located in the southern region of the Holland Coast. Data that is collected ranges from Argus video imagery, Aeolian sediment transport, grain size distributions and 3D laser mapping bathymetries to jetski based near shore bathymetries. This data, gathered by various partners, is already routinely stored in the OpenEarthRawData repository and will in the near future become available through OpenEarth for other projects as well.
Various data examples
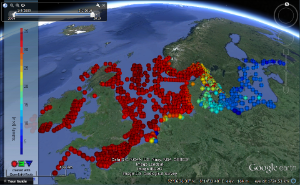
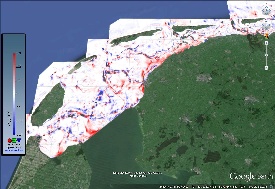
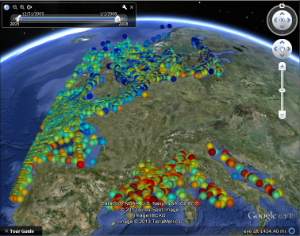
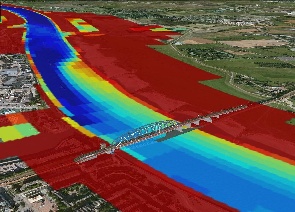
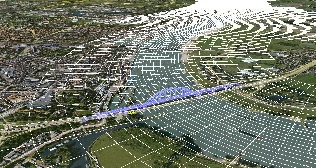
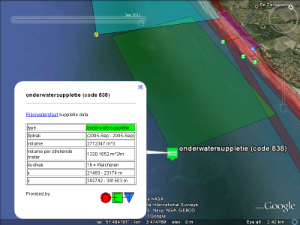
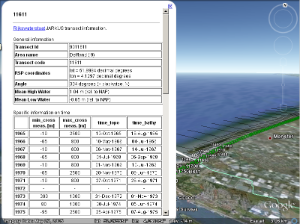
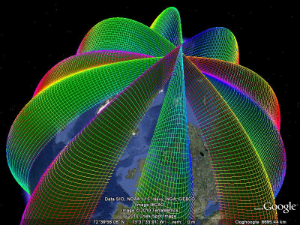
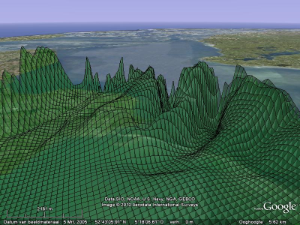
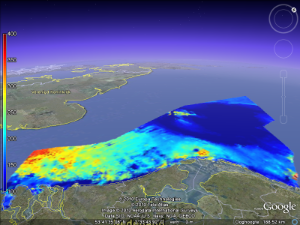
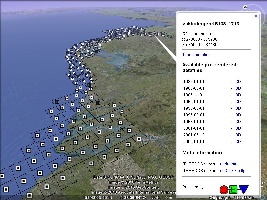
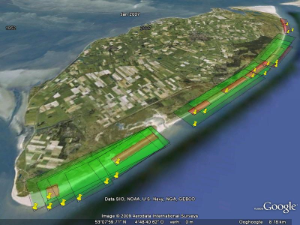
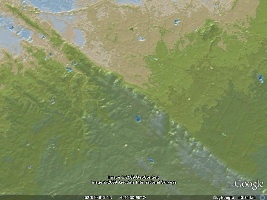
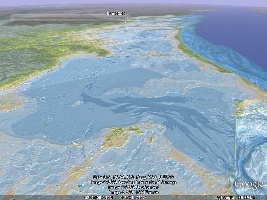
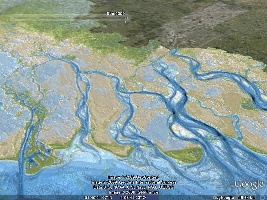
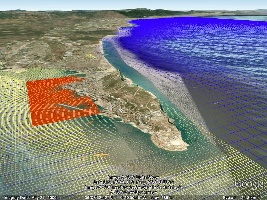
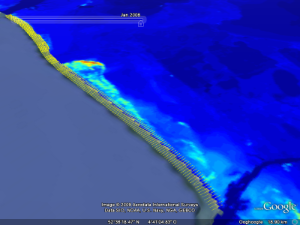
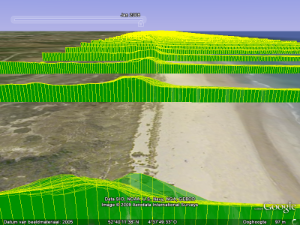
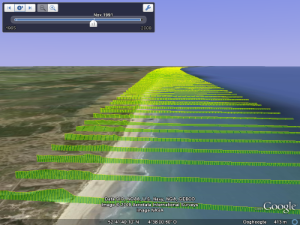
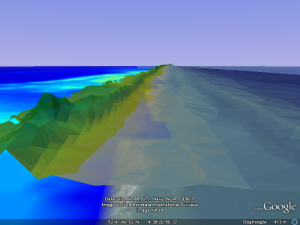
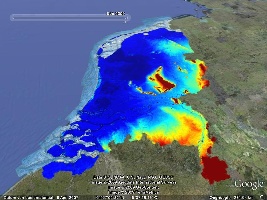
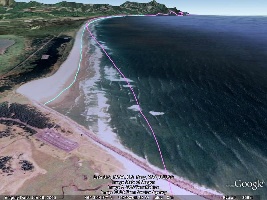
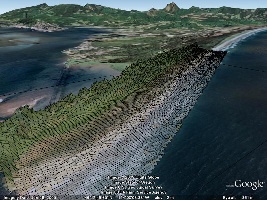
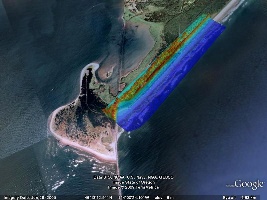
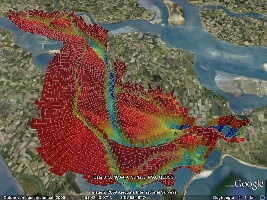
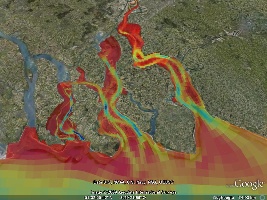
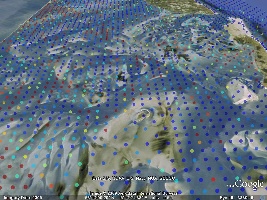
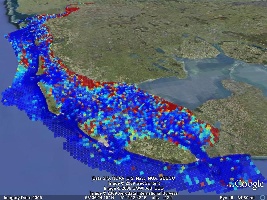
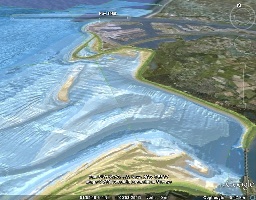
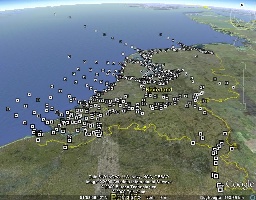
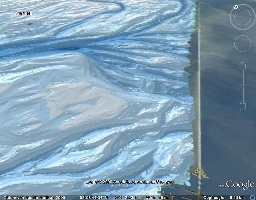
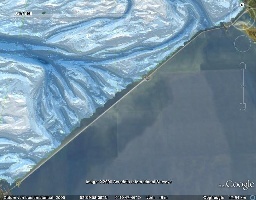
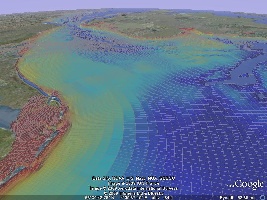
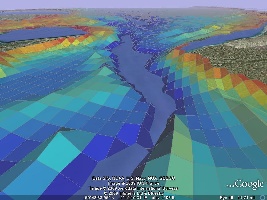
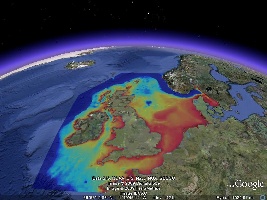
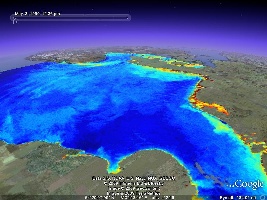
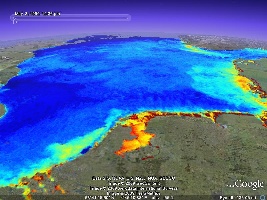
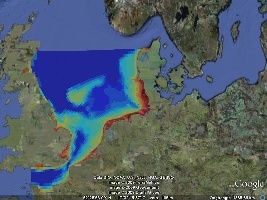
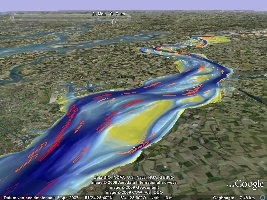
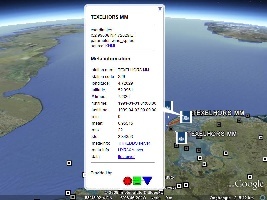
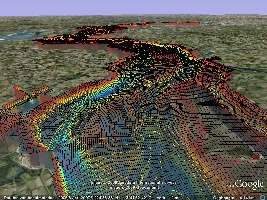
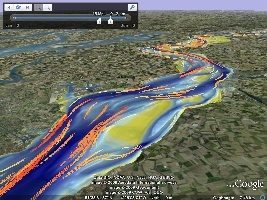
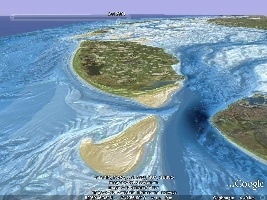
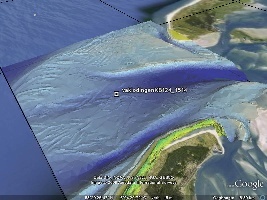
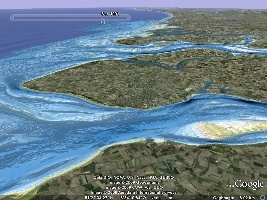
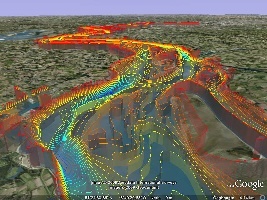
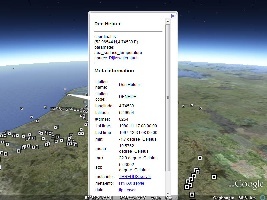
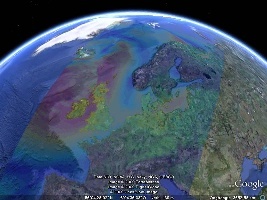
This is a demonstration of various data visualizations that we have made using a combination of Matlab, the free tools in the OpenEarth toolbox, and the Google Earth TM mapping service. To make your own, just sign up and check out the tutorials for the googleplot toolbox. In an NCK 2012 paper we have shown that plotting data into Google Earth is possible for a wide variety of coastal datasets.
| 
| 
| 
|
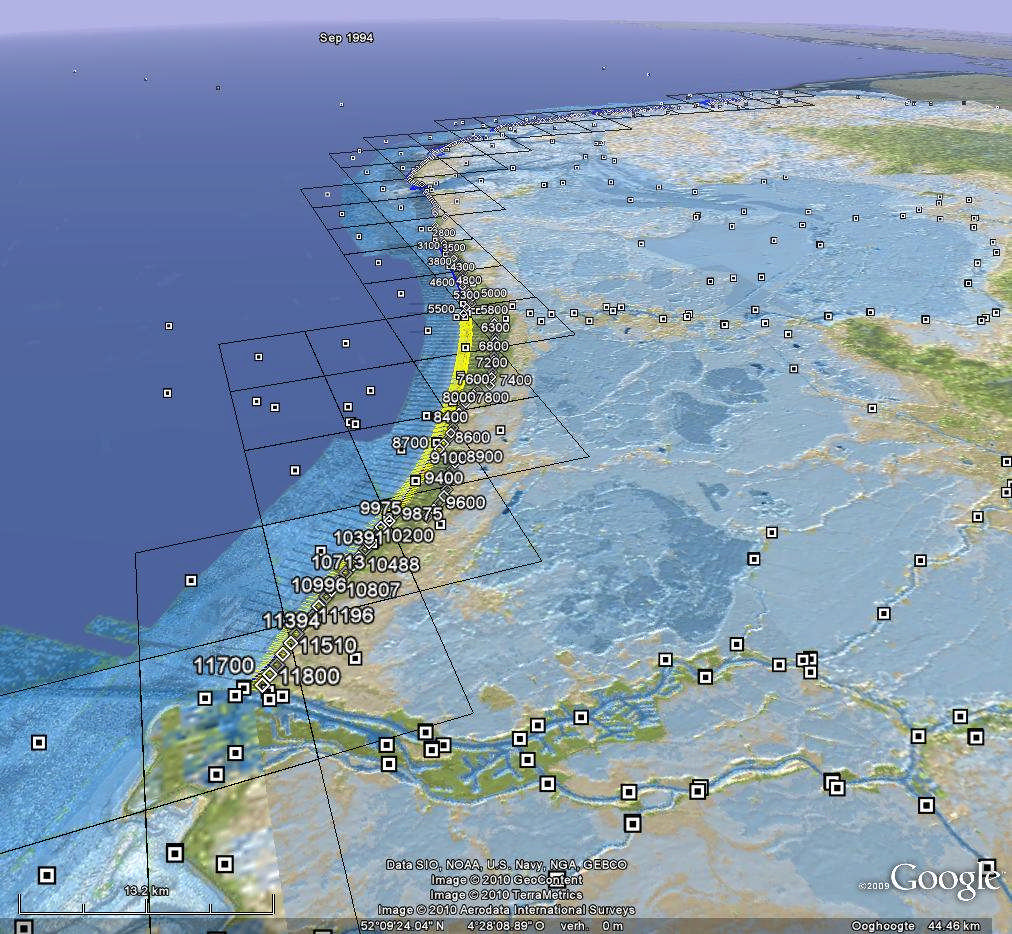
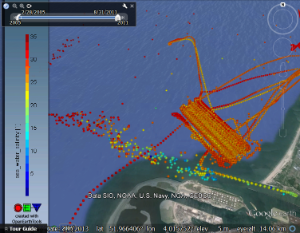
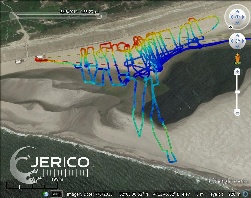
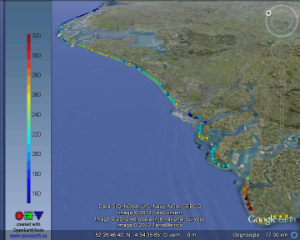
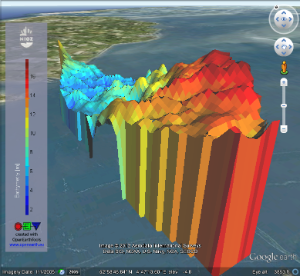
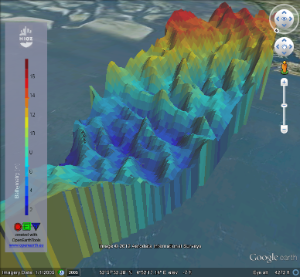
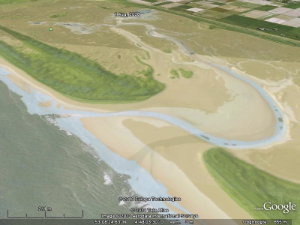
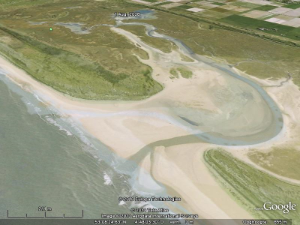
| RIjkswaterstaat scanfish (meetvis) salinity data for one month | Beach and foreshore elevation of Sand engine gathered with DGPS on quad and wheel barrow during JERICO 2014 summerschool | Beach and foreshore elevation of Sand engine gathered with DGPS on quad and wheel barrow during JERICO 2014 summerschool | |
| 
| 
| 
|
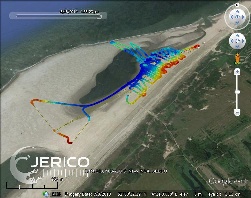
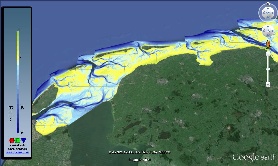
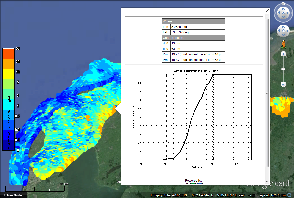
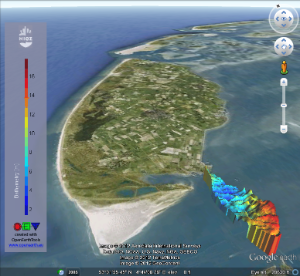
| Beach and foreshore elevation of Sand engine gathered with DGPS on quad and wheel barrow during JERICO 2014 summerschool | Beach and foreshore elevation of Sand engine gathered with DGPS on quad and wheel barrow during JERICO 2014 summerschool | ICES 2009 salinity obtained with OET tool getICESdata.m from SOAP service http://ocean.ices.dk/webservices/hydchem.asmx | Sedimentation/erosion rate for mud (grain size < 63 mum) in the Wadden Sea based on vaklodingen
1985-2013 in combination with the sediment atlas (grain size) data. |
| 
| 
| 
|
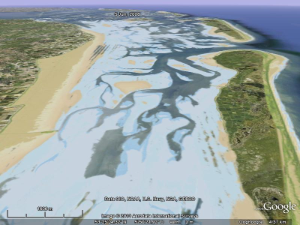
| Sedimentation/erosion rate within the Wadden Sea based on the vaklodingen dataset 1985 to 2013. | Wadden Sea most recent bathymetry based on ‘Vaklodingen’-dataset. | sediment atlas waddenzee with grains zie disdistribution graphs | Vessels of Opportunity temperature data |
| 
| 
| 
|
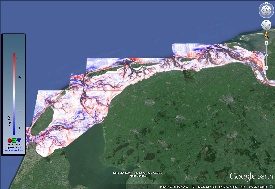
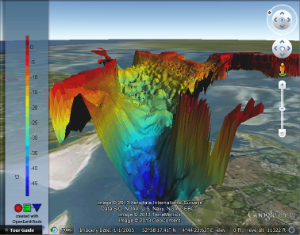
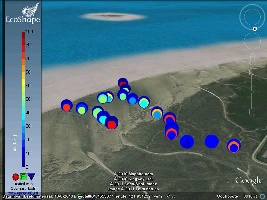
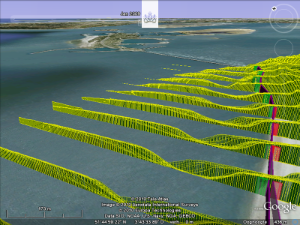
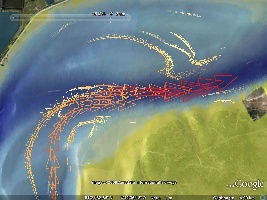
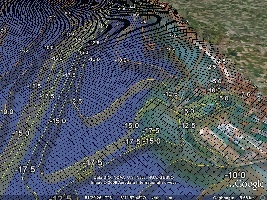
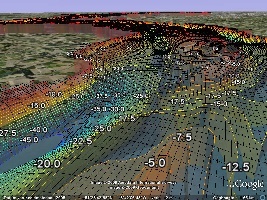
| vaklodingen tile KB122_2120 2D view created with KMLsurf.m | vaklodingen tile KB122_2120 3D view created with KMLsurf.m | Observations of common scoters near Voordelta (PMR-NCV project Deltares) | Rijkswaterstaat kusthoogte lidar data with its airplane tracks (Voordelta) |
| 
| 
| 
|
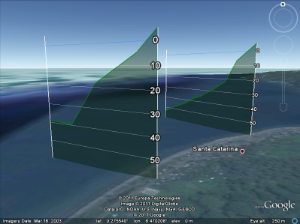
| Rijkswaterstaat kusthoogte lidar data with its airplane tracks (Ems-Dollard) | Delft3D model of Patos Lagoon (Brazil) plotted with colormap “bathymetry_vaklodingen”. Model is part of OpenearthModels. | Delft3D model of Patos Lagoon (Brazil) plotted with colormap “GMT_globe”. Model is part of OpenearthModels. | Delft3D model of Patos Lagoon (Brazil) plotted with colormap “GMT_ocean”. Model is part of OpenearthModels. |
| 
| 
| 
|
| Legally binding VTV grain sizes along Dutch coast | Overview of coastal indicators 2, Bas Huisman, framework of BwN HK3.8 and HK4.1 | Overview of coastal indicators, Bas Huisman, framework of BwN HK4.1 and HK3. | NIOZ TESO veerboot metingen |
| 
| 
| 
|
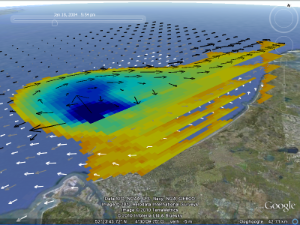
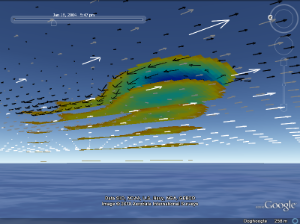
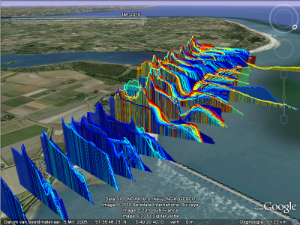
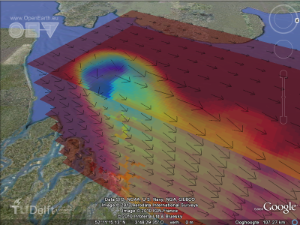
| NIOZ TESO veerboot metingen | NIOZ TESO veerboot metingen | Kustlijnkaartenboek2012: Ameland | HIRLAM model output absolute velocites at 10m as isolines on top of the ground pressures scaled to z levels (gray tones) (multiple time steps). |

| 
| 
| 
|
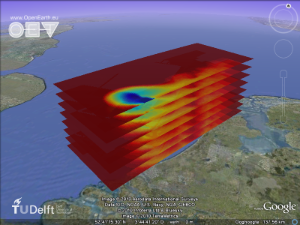
| HIRLAM model output ground pressures scaled to z levels and isolines (1 time step). | HIRLAM model output ground pressures scaled to z levels and isolines (multiple time steps). | HIRLAM model output absolute velocites at 10m as isolines on top of the ground pressures scaled to z levels (gray tones) (1 time step). | Surface heights for the Dutch coast (Rijkswaterstaat) |
| 
| 
| 
|
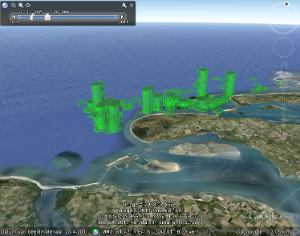
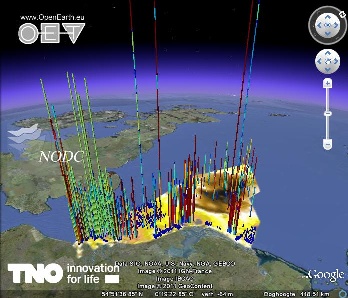
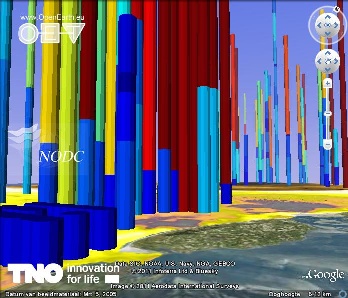
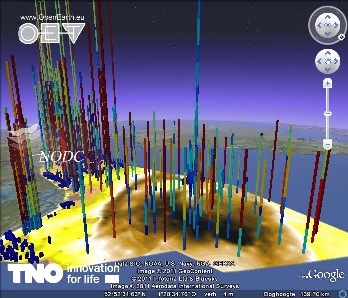
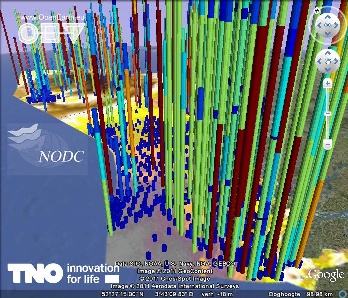
| 3D cores of the NCP by Geological Survery of the Netherlands (TNO dinoloket.nl) | 3D cores of the NCP by Geological Survery of the Netherlands (TNO dinoloket.nl) | 3D cores of the NCP by Geological Survery of the Netherlands (TNO dinoloket.nl) | 3D cores of the NCP by Geological Survery of the Netherlands (TNO dinoloket.nl) |
|  | 
| 
|
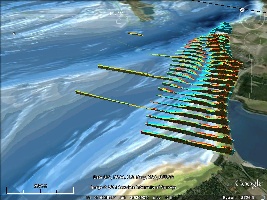
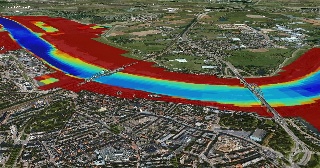
| Rijkswaterstaat vaklodingen + JarKus | Bed topography of DVR model (Delft3D) for the Waal River near Nijmegen | Bed topography of DVR model (Delft3D) for the Waal River near Nijmegen | DVR numerical grid for the Waal River near Nijmegen |
| 
| 
| 
|
| Rijkswaterstaat – beach and foreshore nourishments with features (1952 – 2010) | Rijkswaterstaat – All the information about time series Jarkus | Deltares – Bed profile along transects, Sao Tome | TU Delft / SKLEC fieldmeasurement Chongming Island (Shanghai) by Steven te Slaa |

| 
| 
| 
|
| TU Delft 3D simulation of Rhine ROFI with Delft3D (doi:10.1016/j.csr.2007.06.011) | TU Delft 3D simulation of Rhine ROFI with Delft3D (doi:10.1016/j.csr.2007.06.011) | Rijkswaterstaat – time series Jarkus beach and foreshore profiles | |
| 
| 
| 
|
| Rijkswaterstaat – time series Jarkus beach and foreshore profiles | Rijkswaterstaat – time series Jarkus beach and foreshore profiles | TU Delft 3D simulation of Rhine ROFI with Delft3D (doi:10.1016/j.csr.2007.06.011) | TU Delft 3D simulation of Rhine ROFI with Delft3D (doi:10.1016/j.csr.2007.06.011) |
| 
| 
| 
|
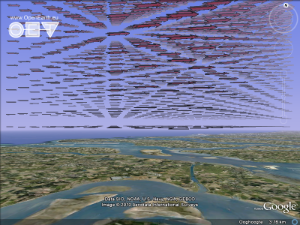
| faux data of 3D atmospheric velocity field | RWS JarKus and coastlines at Banjaard location, Zeeland | Rijkswaterstaat Lidar data of coast: slufter, Texel (Lidar data higlighted) | Rijkswaterstaat Lidar data of coast: slufter, Texel (aereal imagery higlighted) |
| 
| 
| 
|
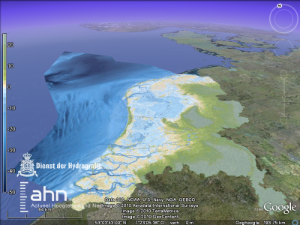
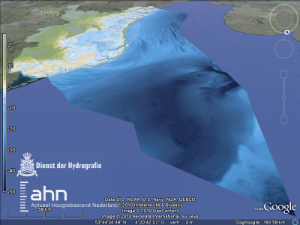
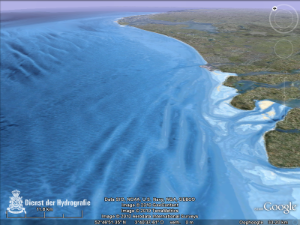
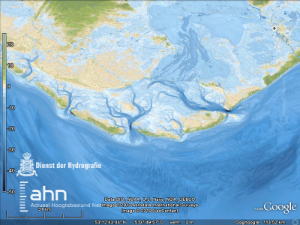
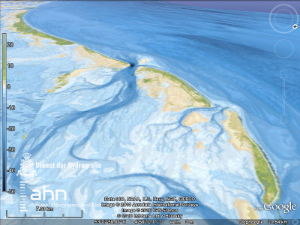
| Rijkswaterstaat Lidar data of WaddenZee | Rijkswaterstaat vaklodingen | Netherlands Hydrographic Office sea bathymetry & AHN land elevation | Netherlands Hydrographic Office sea bathymetry & AHN land elevation |
| 
| 
| 
|
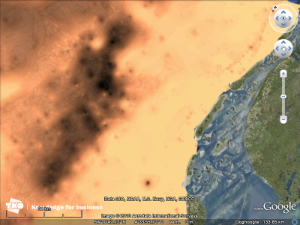
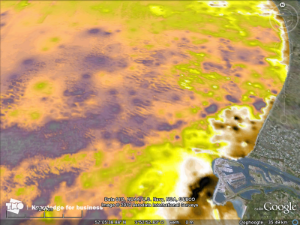
| Netherlands Hydrographic Office sea bathymetry of Dutch Continental Shelf | Netherlands Hydrographic Office sea bathymetry & AHN land elevation | Netherlands Hydrographic Office sea bathymetry & AHN land elevation | TNO Bouw en Ondergrond sediment data (silt in bed) van Dutch Continental Shelf |
| 
| 
| 
|
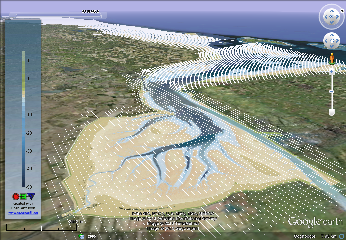
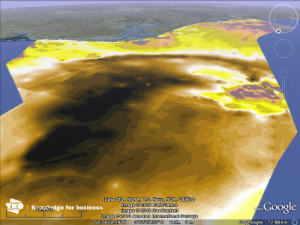
| TNO Bouw en Ondergrond sediment data (D50) van Dutch Continental Shelf | TNO Bouw en Ondergrond sediment data (D50) van Dutch Continental Shelf | TNO Bouw en Ondergrond sediment data (D10) van Dutch Continental Shelf | Delft3D modeling results after 200 yrs of bathymetric development in Western Scheldt starting from an initially flat bed based on 1998 sediment volume. Mick van der Wegen, UNESCO-IHE. |

| 
| 
| 
|
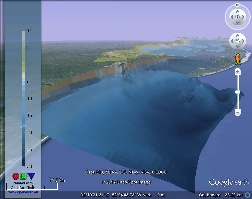
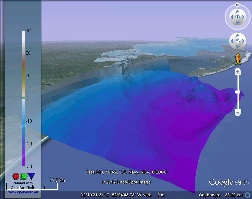
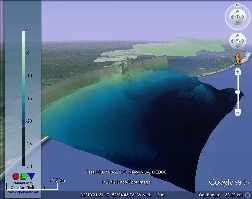
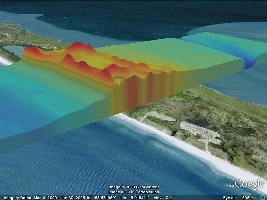
| Delft3D modeling results after 100 yrs of bathymetric development in Western Scheldt starting from an initially flat bed based on 1998 sediment volume. Mick van der Wegen, UNESCO-IHE. | Delft3D modeling results after 50 yrs of bathymetric development in Western Scheldt starting from an initially flat bed based on 1998 sediment volume. Mick van der Wegen, UNESCO-IHE. | Delft3D modeling results after 25 yrs of bathymetric development in Western Scheldt starting from an initially flat bed based on 1998 sediment volume. Mick van der Wegen, UNESCO-IHE. | 3D kml of dunes |
| 
| 
| 
|
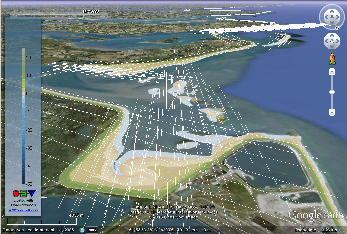
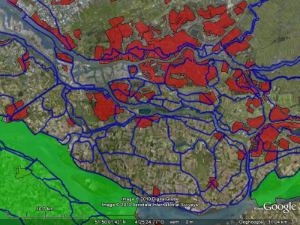
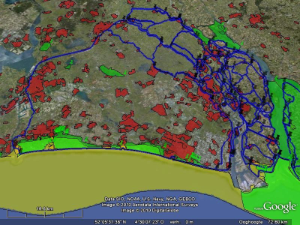
| Dijkringen, residential areas and habitat areas in larger Rotterdam area | Dijkring 14 with residential areas and habitat areas and kustfundament | 3D mesh of faux data “christo” | Deltares Delft3D bathymetry of Markermeer |

| 
| 
| 
|
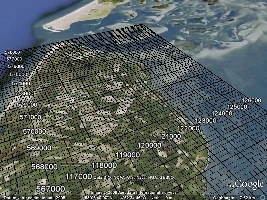
| Filled 3D contour plot of faux data | Filled 3D contour plot of faux data | TNO NCP sediment grain size d10 map (gridded) | Rijkswaterstaat vaklodingen kaartbladen overview |

| 
| 
| 
|
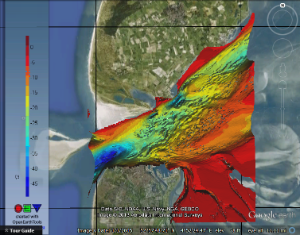
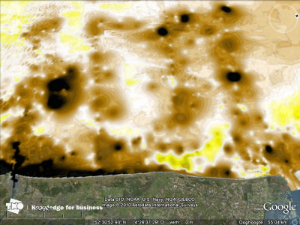
| NASA MODIS image of 2009 Dec 22nd [http://onearth.jpl.nasa.gov] & Rijkswaterstaat vaklodingen | Rijkswaterstaat beach and foreshore nourishments since 1952 | AHN/TNO Actueel Hoogtebestand Nederland (100m) | AHN/TNO Actueel Hoogtebestand Nederland (100m) & Rijkswaterstaat vaklodingen |
| 
| 
| 
|
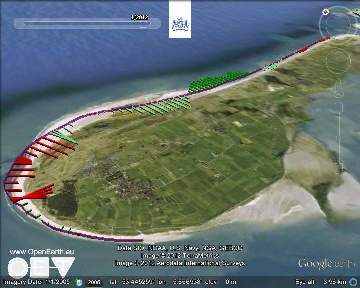
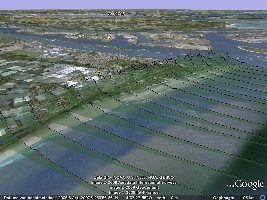
| AHN/TNO Actueel Hoogtebestand Nederland (100m) & Rijkswaterstaat vaklodingen | Deltares Delft3D/SWAN model grids Gibraltar | Rijkswaterstaat JarKus beach measurements & AHN/TNO Actueel Hoogtebestand Nederland (100m) | Rijkswaterstaat JarKus beach measurements |
| 
| 
| 
|
| Rijkswaterstaat JarKus beach measurements | Rijkswaterstaat JarKus beach measurements (gridded) | AHN/TNO Actueel Hoogtebestand Nederland (100m) | USGS beach data |
| 
| 
| |
| USGS beach data | USGS beach data | USGS beach data | Deltares Delft3D Grevelingen model |
| 
| 
| 
|
| Deltares Delft3D Grevelingen model | Rijkswaterstaat Sediment Atlas Waddenzee | Rijkswaterstaat Sediment Atlas Waddenzee | Rijkswaterstaat vaklodingen |
| 
| 
| 
|
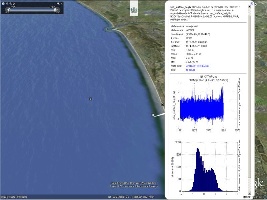
| Rijkswaterstaat waterbase locations | Rijkswaterstaat vaklodingen | Rijkswaterstaat vaklodingen | Deltares Delft3D ZUNO fijn model |
| 
| 
| 
|
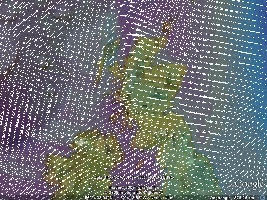
| Deltares Delft3D ZUNO model | Rijkswaterstaat WAQUA / Deltares Delft3D – DCSM model | NOAA/KNMI SST sea surface temperature satellite image | NOAA/KNMI SST sea surface temperature satellite image |
| 
| 
| 
|
| NOAA/KNMI SST sea surface temperature satellite image | Deltares Delft3D ZUNO model | Deltares Delft3D results | KNMI wind locations |
| 
| 
| 
|
| Deltares Delft3D results | Deltares Delft3D bathymetry Westerschelde | Deltares Delft3D bathymetry | Deltares Delft3D bathymetry |
| 
| 
| 
|
| Deltares Delft3D results | Rijkswaterstaat vaklodingen | Rijkswaterstaat vaklodingen kaartblad | Rijkswaterstaat vaklodingen |
| 
| 
| 
|
| Deltares Delft3D bathymetry | Rijkswaterstaat waterbase locations | KNMI HIRLAM surface temperature | Rijkswaterstaat vaklodingen Rijksdriehoek grid |

| 
| 
| 
|
| Deltares Delft3D simulation of Katrina | Rijkswaterstaat kustlijnen | Rijkswaterstaat JarKus beach measurements | KNMI HIRLAM wind vectors |