Monitoring
Around 2009, knowledge on the relationship between ecology and the seabed was predominantly based on expert judgement and a few scattered data sets. This project offered a unique opportunity to gather field data.
During design and preparation of the project a solid monitoring plan was drafted, making use of on data collected in a baseline study. During the recolonization phase after the sand extraction operation and the development of ecosystem-based landscaped sand bars much data from short term monitoring campaigns was gathered. Next to monitoring results about short-term effects, medium and long-term data are currently collected during the recolonization measurements of the Port of Rotterdam (PoR).
Monitoring plan
Monitoring in the Maasvlakte 2 (MV2) sand extraction sited focused on the general effects and the landscaped sand bars. General effects were studied in a deep area without landscaping and the effects of landscaping were studied at two landscaped sand bars .
The monitoring was meant to provide answers to the following questions:
- What are the ecological effects of the landscaped sand bars and what is beneficial effect on the local ecosystem?
- What physical effects were responsible for possible differences between normal sand extraction and extraction with ecosystem-based landscaping?
- How do the sand bars evolve morphologically (migration, deformation) and sedimentologically (sediment composition)?
Baseline study
To assess the situation prior to the large-scale and deep sand extraction for the construction of MV2, data were collected by NIOZ and IMARES in the framework of the baseline study for the Environmental Impact Assessment (EIA). The EIA was commissioned by the Port of Rotterdam (PoR) and investigates (ecological) effects of the Maasvlakte 2 project. A set of 470 box corer and bottom sledge samples from the baseline monitoring campaign of PoR was selected from data collected in April-June 2006 and 2008 at 235 locations in a 2500 km2 study area off Rotterdam.
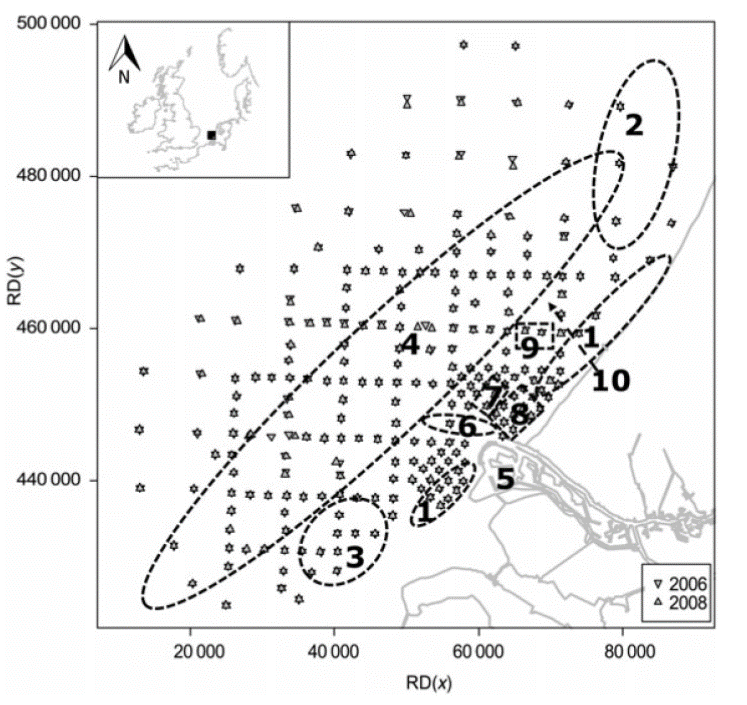
The box corer had a surface area of 0.084 m2 and a maximum penetration depth of 30 cm. Samples were wet-sieved using a 1 mm mesh sieve and the residue was stored in jars with a seawater solution of 6% buffered formaldehyde (Perdon & Kaag 2006, Craeymaeersch & Escaravage 2010). The bottom sledge was equipped with a 5-mm mesh cage of 10 cm, penetrating up to 10 cm into the seabed. On average, a surface area of 15 m2 was sampled during each sledge haul of around 150 m length. The following bio aspects were analyzed:
- Specimens were identified up to species level when possible.
- Infaunal ash-free dry weight biomass (g AFDW m-2) was analysed by means of loss on ignition (2 days at 80°C followed by 2 hours at 580°C).
- Wet weight of epifauna without sampled fish (g m-2 WW) was directly measured.
- Biomass of razorblade Ensis spp. was determined by using regression equations based on previous IMARES field surveys (Craeymeersch & van der Land 1998).
Sediment samples from the upper 5 cm were collected from untreated boxcorer samples and kept frozen until analysis. Sediment samples were analysed with a Malvern Mastersizer 2000 particle size analyser. The following characteristics of the sediment samples were analyzed:
- Percentile sediment grain size (D10, D50, D90) .
- Grain size distribution among the different classes; clay (< 4 μm), silt (4-64 μm), mud (<63 μm), very fine sand (63 μm-125 μm), fine sand (125 μm-250 μm), medium sand (250 μm-500 μm) and coarse sand (> 500 μm) was measured as percentage of total volume (vol%).
- Sediment sorting (D90/D10) was determined.
- Sediment organic matter (SOM) was analysed by means of loss on ignition (freeze-dried sediment samples were placed for 2 hrs at 580°C) and values of SOM were calculated as percentage of sediment mass (mass%).
Monitoring campaign
A monitoring campaign was designed and aligned with the survey campaign of PoR to maximize inter compatibility and amount of field data output and to reduce costs. During the campaign focus was placed on the short-term effects in the sand extraction site on macrozoobenthos (infauna and epifauna), demersal fish, sediment characteristics, sedimentation-erosion and hydrodynamics.
Macrozoobenthos short-term monitoring campaign
To ensure comparable data, sampling was carried out using identical protocols as during the baseline study (De Jong et al., 2015a; Perdon and Kaag, 2006) and during the recolonization study of the Environmental Impact Assessment (EIA) of the Port of Rotterdam for the construction of Maasvlakte 2 (runs from 2014-2018) . A box corer with a surface area of 0.077 m2 was used to sample sediment and infauna, organisms larger than 1 mm and mainly living in the seabed. A bottom sledge was used to sample macrobenthic in- and epifauna with a size range of 0.5 – 10 cm. Bottom sledge samples are hereafter called epifauna (EP) beacause the largest part is epifauna although infauna was collected as well (De Jong et al., 2015b).
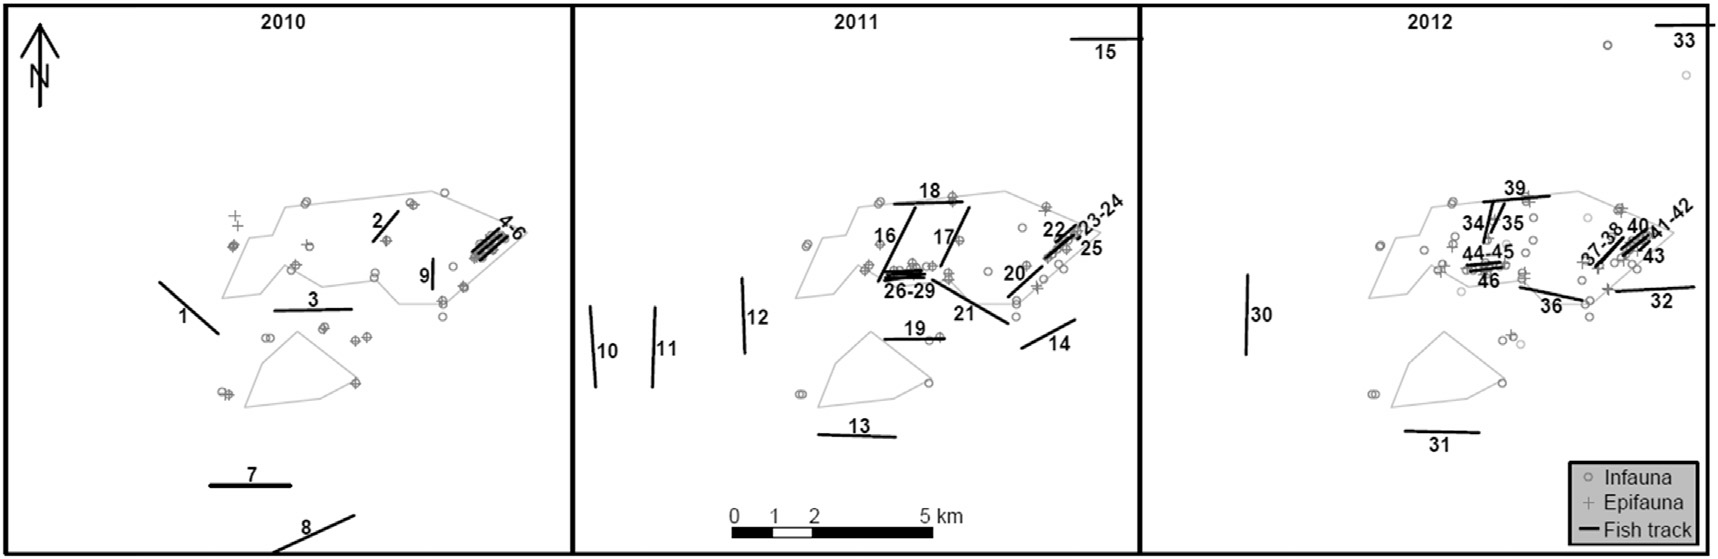
Sampling with the box corer was executed by the Royal Netherlands Institute for Sea Research (NIOZ) on 29–30th June 2010, 2–5th May 2011 and 23–25th April 2012. In 2010 and 2011, 45 and in 2012, 64 box corer samples were collected. To reach a higher spatial resolution in- and outside the extraction site in 2012, a subsample of the box core sample was analysed which reduced the sampled surface area to 0.015 m2. Four samples were collected in the deep parts of the extraction site, 14 samples in the reference area (near and far field) and four samples in the shipping lane area. No maintenance dredging was executed in the shipping lane according to Rijkswaterstaat. Specimens were identified up to species level when possible and ash-free dry weight biomass (g AFDW m-2) was analysed by means of loss on ignition, 2 days at 80 °C followed by 2 h at 520 °C.
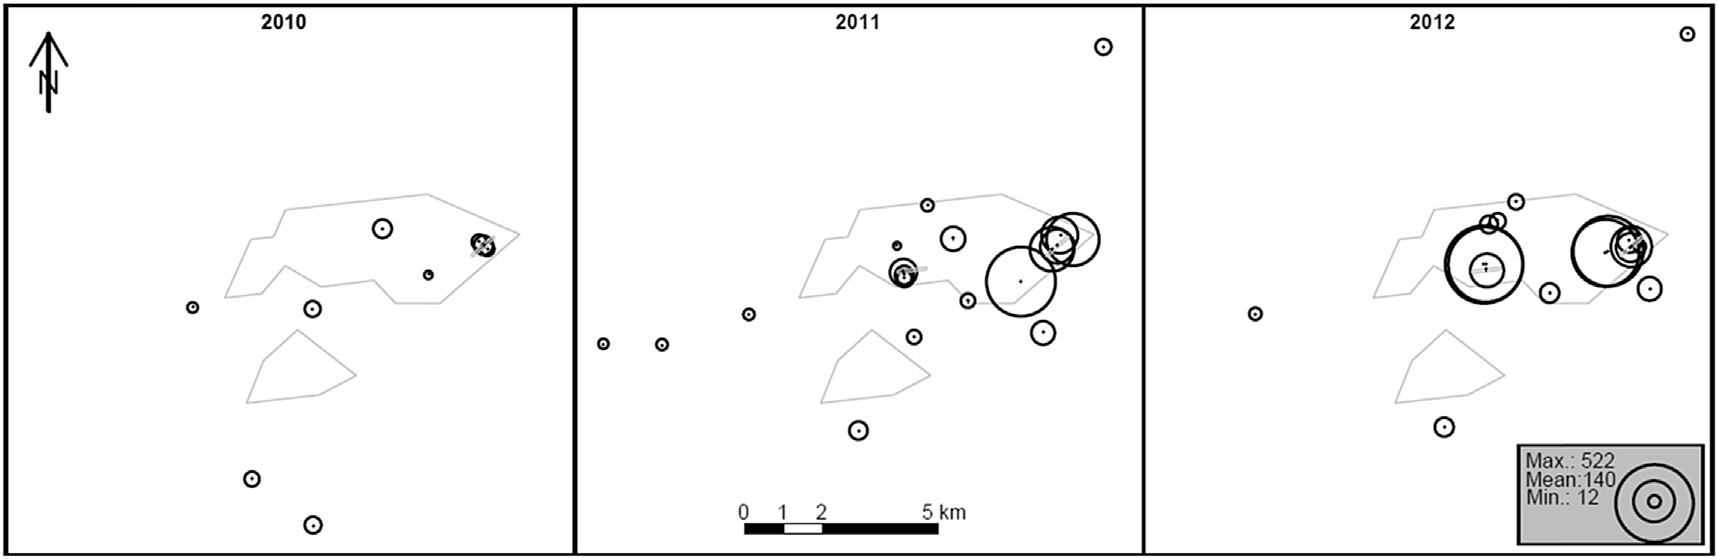
Sampling with the bottom sledge for epifauna was conducted by the Institute for Marine Resources & Ecosystem Studies (IMARES Wageningen UR) on 7–8th July 2010, 14–15th June 2011 and 6–7th June 2012. The bottom sledge was equipped with a 5-mm mesh cage. On average, a surface area of 15 m2 was sampled during each sledge haul of approximately 150 m length, 10 cm width and a maximum penetration depth of 10 cm. In 2010 and 2011, 26 and in 2012, 32 bottom sledge samples were collected. In 2010, 11 bottom sledge samples were collected in the reference area. In 2012, three samples were collected in the shipping lane area of the Port of Rotterdam and one sample in the reference area. Specimens were identified up to species level when possible. Wet weight of epifauna was directly measured after sorting (g m-2 WW). Biomass of Atlantic jackknife clam Ensis sp. was determined by using regression equations based on previous IMARES field surveys. Sampling locations are visualised in figure 11 and 12.
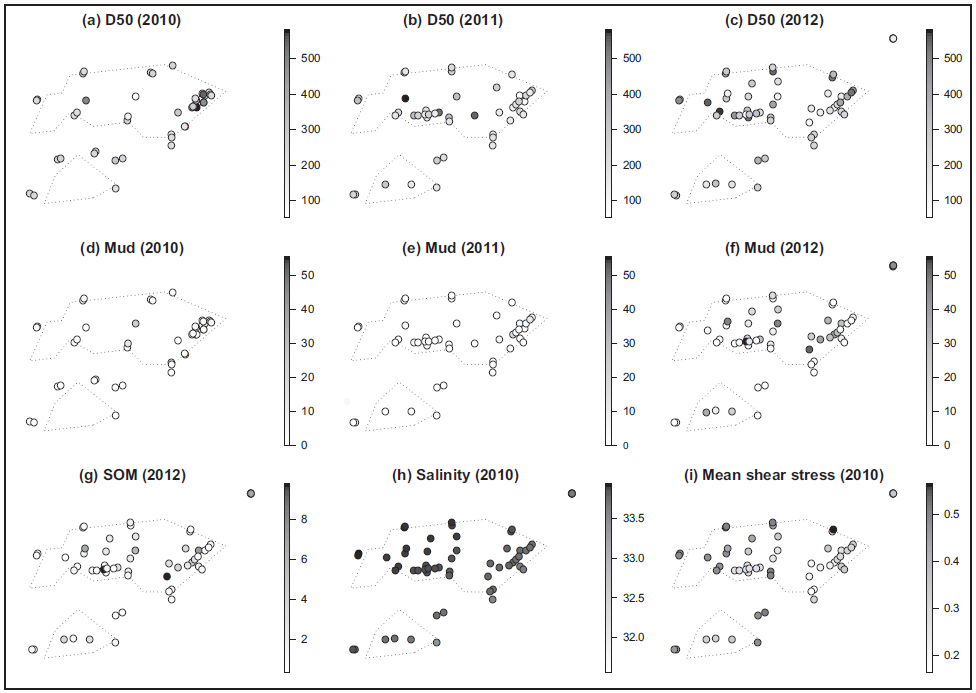
Sediment characteristics
Samples from the upper 5 cm of sediment were collected from untreated boxcorer samples and kept frozen until analysis. Sediment samples were freeze dried, homogenised and analysed with a Malvern Mastersizer 2000 particle size analyser. Percentile sediment grain size (D10, D50, D90) and sediment grain size distribution among the different classes; clay (<4 mm), silt (4-63 mm), mud (<63 mm), very fine sand (63 mm-125 mm), fine sand (125 mm-250 mm), medium sand (250 mm-500 mm) and coarse sand (>500 mm) were measured as percentage of total volume. Sediment organic matter (SOM) was analysed in 2012 by means of loss on ignition as percentage of sediment mass (freeze-dried sediment samples were placed for 2 hours at 520 °C) (De Jong et al., 2014).
Modelling of abiotic variables
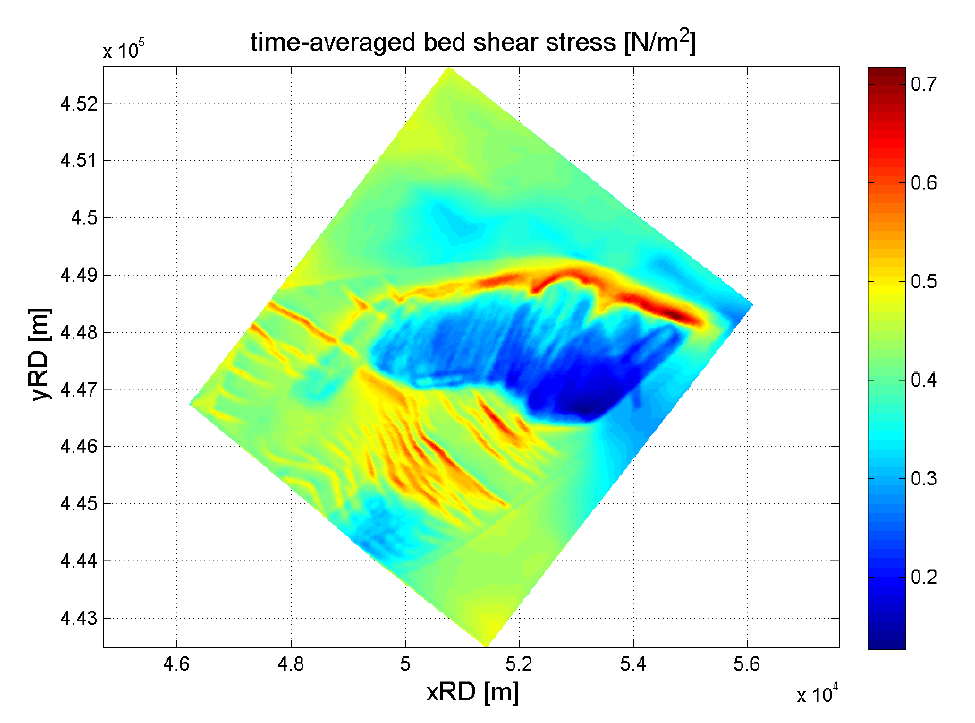
The sand extraction site and surrounding area have complex hydrodynamic conditions. Due to the region of fresh water input (ROFI) from the Rhine River, periods of strong haline stratification, up- and downwelling, wind-driven flow, baroclinic cross-shore flows and wind and wave-induced mixing occur frequently. This may lead to considerable fluctuations in salinity and bottom shear stress. Delft 3D DD ZUNO has been used, a hydrodynamical model of the southern North Sea consisting of a coarse curvilinear horizontal grid with two grid refinement towards the Dutch coast through domain decomposition (DD). The nested model grid covers an area of about 7.5 km by 7.0 km and the horizontal grid size is about 45 m by 38 m for the research area.
To generate appropriate boundary conditions for the nested model (Maasvlakte 2 sand extraction site), four open boundaries were used with tangential velocity (Tonnon et al., 2013). Twelve vertical σ-layers were specified, the relative thickness of these has been chosen in such way that near-bed and near-surface vertical gradients were better resolved. From top to bottom, these layers represent respectively 4.0%, 5.6%, 7.8%, 10.8%, 10.9%, 10.9%, 10.9%, 10.9%, 10.8%, 7.8%, 5.6%, and 4.0% of the water depth. The bathymetry of the nested model was interpolated from multibeam measurements performed by the dredging companies in October 2010. The model was forced with measured meteorological and riverine discharge data for the specific period. In order to keep the calculation time manageable, one single spring-neap cycle with relatively high river discharges was used for validation. During December to April, the largest riverine discharges can be expected and stratification is more likely to occur. The period between 2 March and 17 March 2007 was simulated using a time step of 15 seconds. Mean and maximum values of bed shear stress (N m-2) and near-bed salinity (ppt) were modelled.
Demersal fish
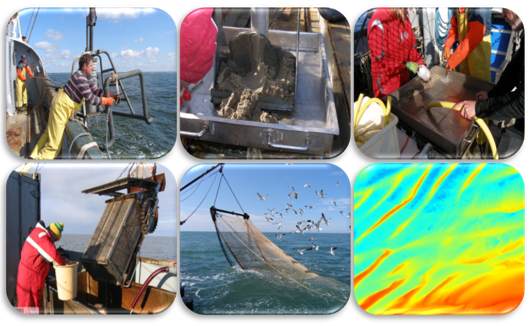
A commercial fishing vessel was used, the Jan Maria, GO 29, with a length of 23 m, less than 300 horsepower and equipped with a standard commercial 4.5 m beam trawl. The beam trawl was equipped with four tickler chains, five flip-up ropes and diamond mesh size of 80 mm, which was applied at 4 knots fishing speed. The ship’s GPS-system logged the position of the sampling locations and water depth was determined with the ship’s depth sounder. The maximum haul distance was one nautical mile in the reference area. Shorter hauls were planned within the sand extraction site; at the landscaped sand bars, hauls of approximately 700 m length were applied. Some of the hauls ended before the planned end coordinates because of difficulties with fishing inside the sand extraction site due to large changes in seabed topography and sediment composition.
In surrounding reference areas, fishing direction was generally perpendicular to the direction of naturally occurring seabed patters to ensure heterogeneous sampling of crests and troughs of sand waves. In the sand extraction site, fishing direction was generally parallel to the seabed structures to enable comparisons between the different locations. Sampling was made in the reference area, at the slope of the sand extraction site, two locations in the deep parts of the extraction site i.e. the south-east and north-west, in the troughs and at the crests of the sand bars.
Monitoring results
Sediment and modelled hydrodynamical variables
An increase in mud content was observed after the cessation of sand extraction. Locations with a high mud value also have a high sediment organic matter content (SOM). Modelled time-averaged bed shear stress is high at the crests of natural occurring sand waves in the reference areas. The northern edge of the northern sand extraction site shows the highest bed shear stress values. The southern part of the northern sand extraction site has the lowest bed shear stress values. Differences in bed shear stress are also visible at the ecosystem-based sand bars.
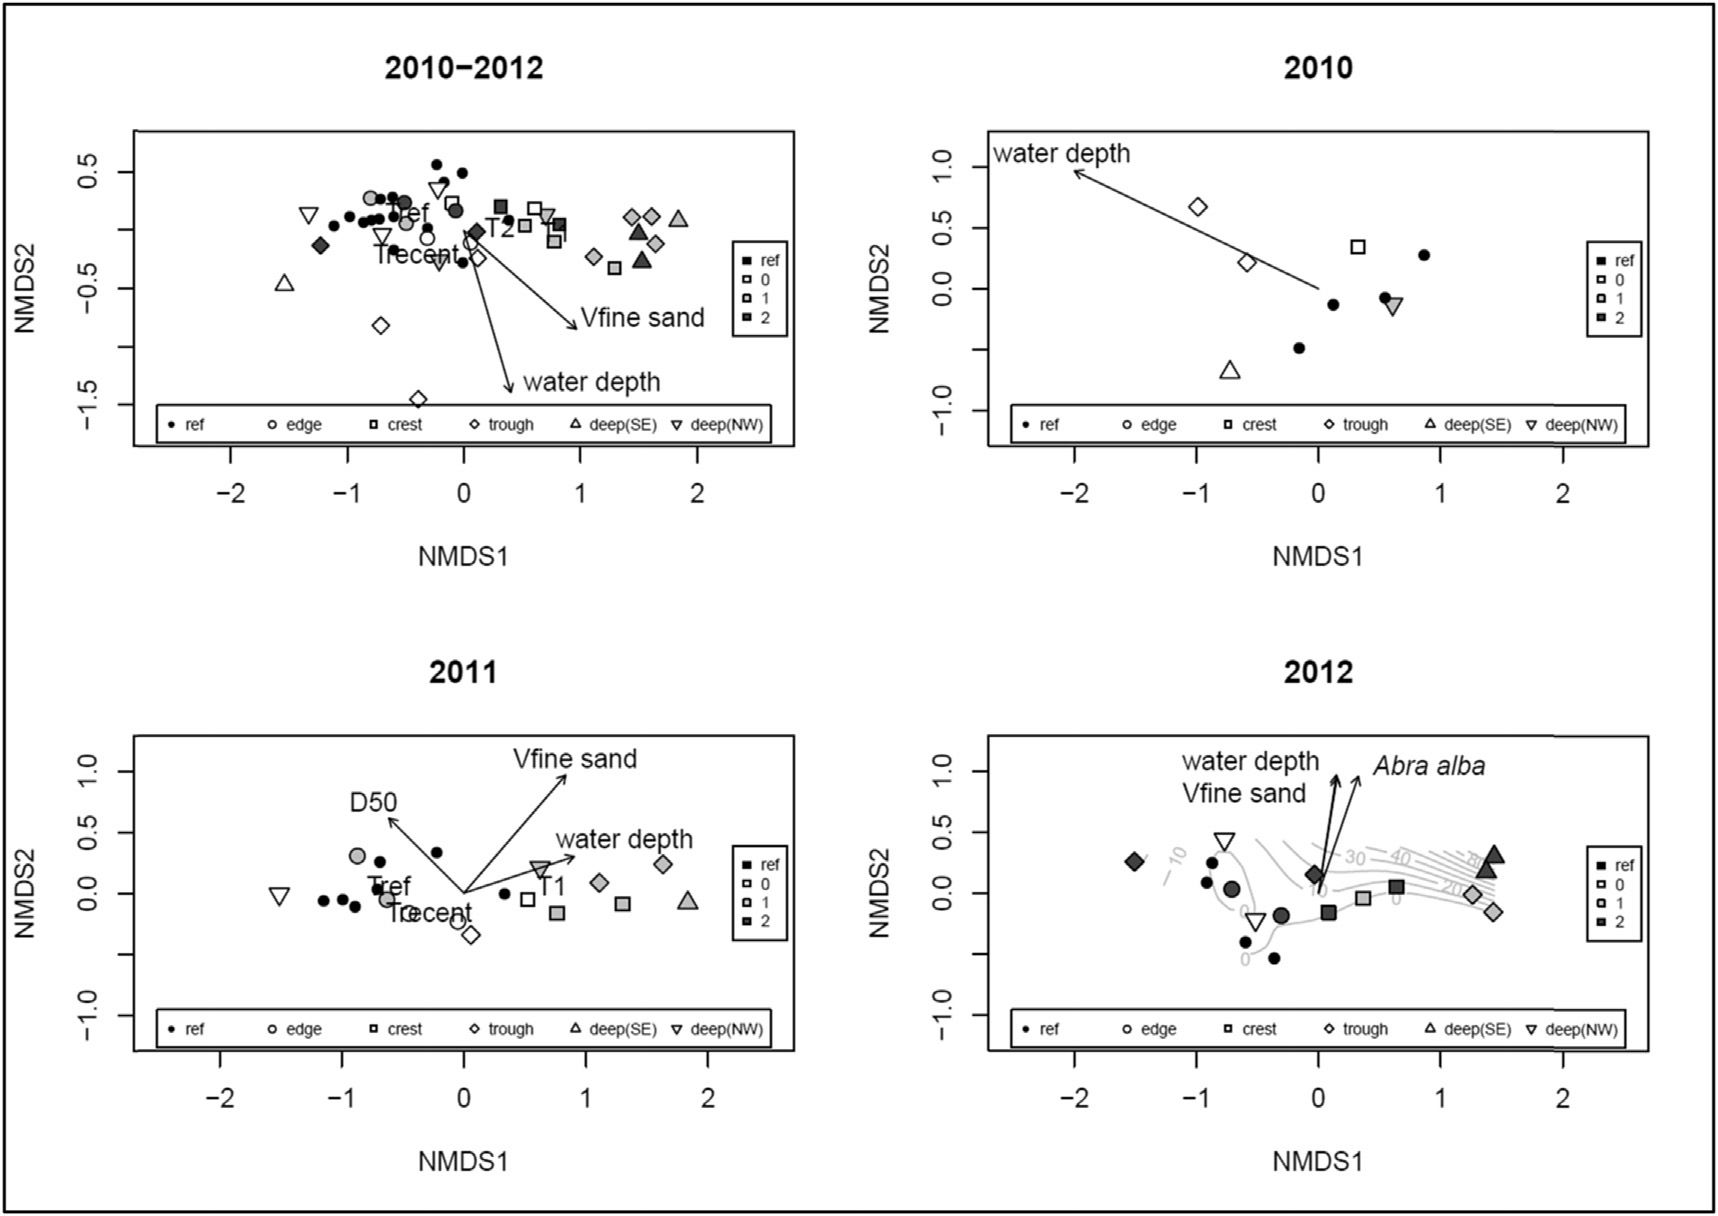
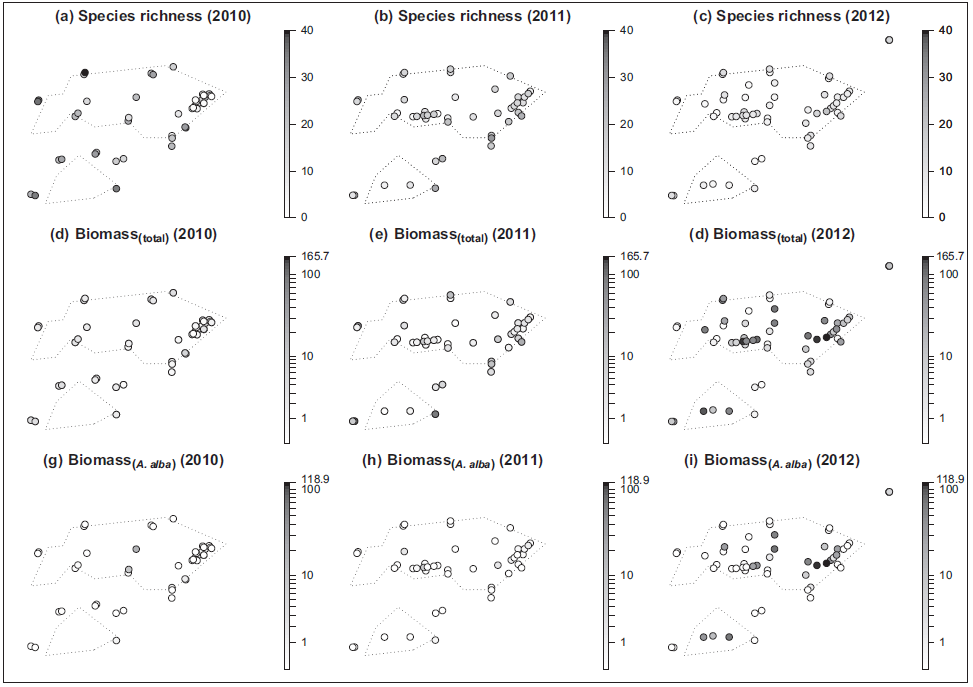
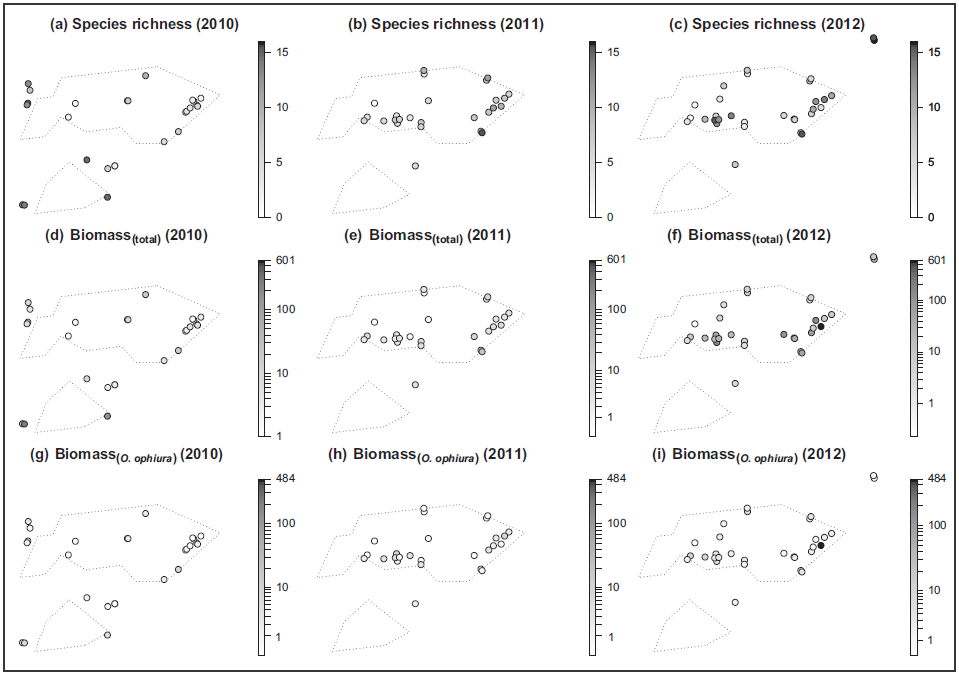
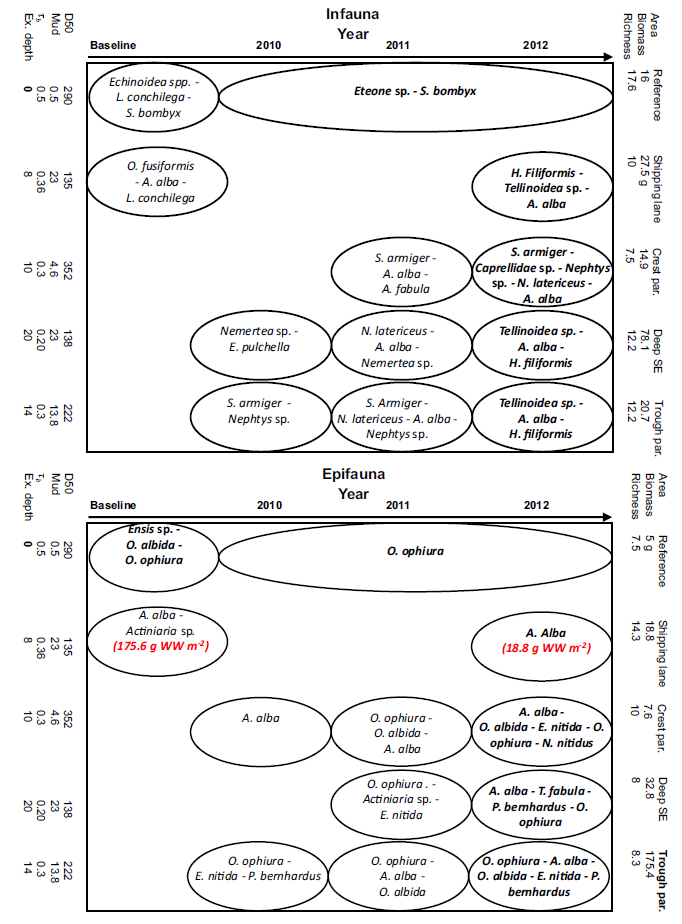
Macrozoobenthos
Two years after the cessation of sand extraction, macrozoobenthic biomass increased five-fold in the deepest areas. Species composition changed significantly and white furrow shell (Abra alba ) became abundant. Several sediment characteristics also changed significantly in the deepest parts. Macrozoobenthic species composition and biomass significantly correlated with time after cessation of sand extraction, sediment and hydrographical characteristics. Ecosystem-based landscaped sand bars were found to be effective in influencing sediment characteristics and macrozoobenthic assemblage. Significant changes in epifauna occurred in deepest parts in 2012 which coincided with the highest sedimentation rate.
Demersal fish species
One and two years after cessation, a significant 20-fold increase in demersal fish biomass was observed in deep parts of the extraction site. The average demersal fish wet weight biomass in the reference areas was 20.9 kg WW ha-1 whereas in the deep areas of the MV2 sand extraction site biomass increased up to 522 kg WW ha–. The most abundant fish species in the extraction site is plaice (Pleuronectes platessa) whereas in the reference areas, dab (Limanda limanda) is most abundant.
In the troughs of a landscaped sand bar however, a significant drop in biomass down to reference levels and a significant change in species assemblage was observed two years after cessation. The fish assemblage at the crests of the sand bars differed significantly from the troughs with tub gurnard (Chelidonichthys lucerna) being a typical species of the crests. This is a first indication of the applicability of landscaping techniques to induce heterogeneity of the seabed although it remains difficult to draw a strong conclusion due the lack of replication in the experiment. An ecological equilibrium is not reached after 2 years since biotic and abiotic variables are still adapting.
Significant differences in demersal fish species assemblages in the sand extraction site were associated with variables such as water depth, median grain size, fraction of very fine sand, biomass of white furrow shell (Abra alba) and time after the cessation of sand extraction. Large quantities of undigested crushed white furrow shell fragments were found in all stomachs and intestines of plaice, indicating that it is an important prey item.