Monitoring during Operation and Maintenance
Given the nature of the pilot, a monitoring program was set op to monitor the ecological development on the structures. Twice a year biomass and species diversity on the structures was determined. Status of the structures was checked each month for safety purposes. These monthly maintenance check-ups were also used to measure present biomass on the strings.
Monitoring
The polehulas in the Scheurhaven were monitored 15 and 34 weeks after construction. After 15 weeks, barnacles (Balanus improvisus) and mussels (Mytilus edulis) were predominant below MLW. Above MLW, algae species Porphyra umbilicalis and Ulva linza, were predominant.
After 34 weeks, a significant shift to mostly mussel abundance was observed. Given the biomass of a reference pole (9,925 g/m2), the biomass of the polehulas is maximum 11.4 times larger (112,996 g/m2) and 8.5 times higher when averaged over all polehulas (84,031 g/m2).
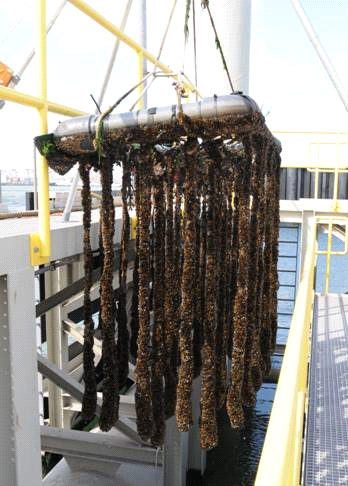
As compared with the polehulas, dominance of mussels was even stronger at the pontoonhulas. No algae were observed there, possibly due to the limited light penetration underneath the pontoonhula. After 19 weeks, average biomass was about 11 g/cm rope. Biomass was largest at the edges of the pontoonhulas and decreased towards the centre, which may be explained by competition for food. At the Scheurhaven, the biomass per cm rope was significanty larger than in the Pistoolhaven, possibly due to the lower and more dynamic salinity in the Pistoolhaven, a factor that negatively influences the growth of mussels (Almada-Villela, 1984; Kautsky, 1982). Moreover, higher turbulence levels in the Scheurhaven may have facilitated a larger supply of oxygen and food to the mussels.
Given a maximum biomass of 348 kg at one pontoonhula in the Scheurhaven, the total time to filter the entire volume of water in the Scheurhaven can be calculated. Based on a study on the colonization of an artificial hard substrate by the same mussel (Joschko et al., 2008), a biomass of 348 kg corresponds with some 247,000 individuals, One mussel is assumed to filter around 35 cm3/min (Dolmer, 2000). Given the total volume of water in the Scheurhaven of about 195,000 m 3, one pontoonhula is able to filter this entire volume in 16 days. Upscaling this to the entire Rotterdam harbour, around 35 pontoonhulas per harbour basin are able to filter the entire volume of water in the harbour within one month.
The monthly check-ups revealed that after a couple of months, the pontoonhulas significantly increased in weight due to the increase in biomass. Consequently, the structures started to sink. Fortunately, they were still attached to existing pontoons by several hawsers. To prevent the pontoonhulas from breaking loose, the number of hawsers attaching them to the pontoons was doubled to keep the pvc-construction of the hulas afloat.
End of life
Pontoonhulas can also help to reduce wave heights as the structures can absorb wave energy. The ropes of the pontoonhulas were included in SWAN-VEG, a numerical model that includes wave dissipation by vegetation. In this model, the wave height, wave period, length of section with ropes and the biomass can be varied. Depth was 4 m and it was assumed that the ropes were 4m as well. Structures achieved wave damping of 14% for a 10 m structure, a low biomass and a wave height of 0.1 m. Up to 80% could be achieved with a 30 m structure, a high biomass and a wave height of 0.5 m. By varying variables such as biomass and length, a conservative estimate can be determined for the wave reducing capacity of these structures. The hula-structures were removed from the field by the end of 2010. The pontoonhulas were transported to the Deltaflume of Deltares. There, they were put in the water and were exposed to both regular and irregular waves to determine their ability to reduce wave height. It was found that for floating structures, wave transmission closely resembles wave transmission by floating breakwaters with the addition that mussel structures penetrate deeper in the water column and are porous. Both these parameters influence the wave attenuation capacity of a structure (van Steeg & van Wesenbeeck 2011). Ideally, the mathematical model exercise should be expanded and the flume study should be used as a validation case for SWAN-VEG. However, this has not yet been done due to budget constraints.