How to Use
Please note that this website is currently not running, but the principle and method can be applied to monitor other locations.
The intended users of the Wave Transformation Table are engineers and scientists dealing with nearshore processes. The tool is available as a web application through the OpenEarth Viewer. Users need an internet connection and a Google Chrome browser and can obtain time series of spectral wave parameters with a few button clicks. For more advanced users, the tool is also available as a Matlab application. For proper interpretation of the results it is recommended to have some experience/expertise in the field of wave modeling and/or monitoring.
Versions
The Wave Transformation Table was available in two versions:
- As an online application accessible through the OpenEarth Viewer.
This version is meant for end-users, i.e. users who want to use the application as is and are not interested in modifying the underlying code. The only requirements for using this application are an internet connection and installation of the Google Earth plug-in (indicated automatically when needed).
Note: This application is known to encounter problems when accessed with Internet Explorer and Firefox. We advise to use Google Chrome instead. - As a Matlab application in OpenEarth.
Functionality
Obtaining wave time series with the Wave Transformation Table involves the following steps:
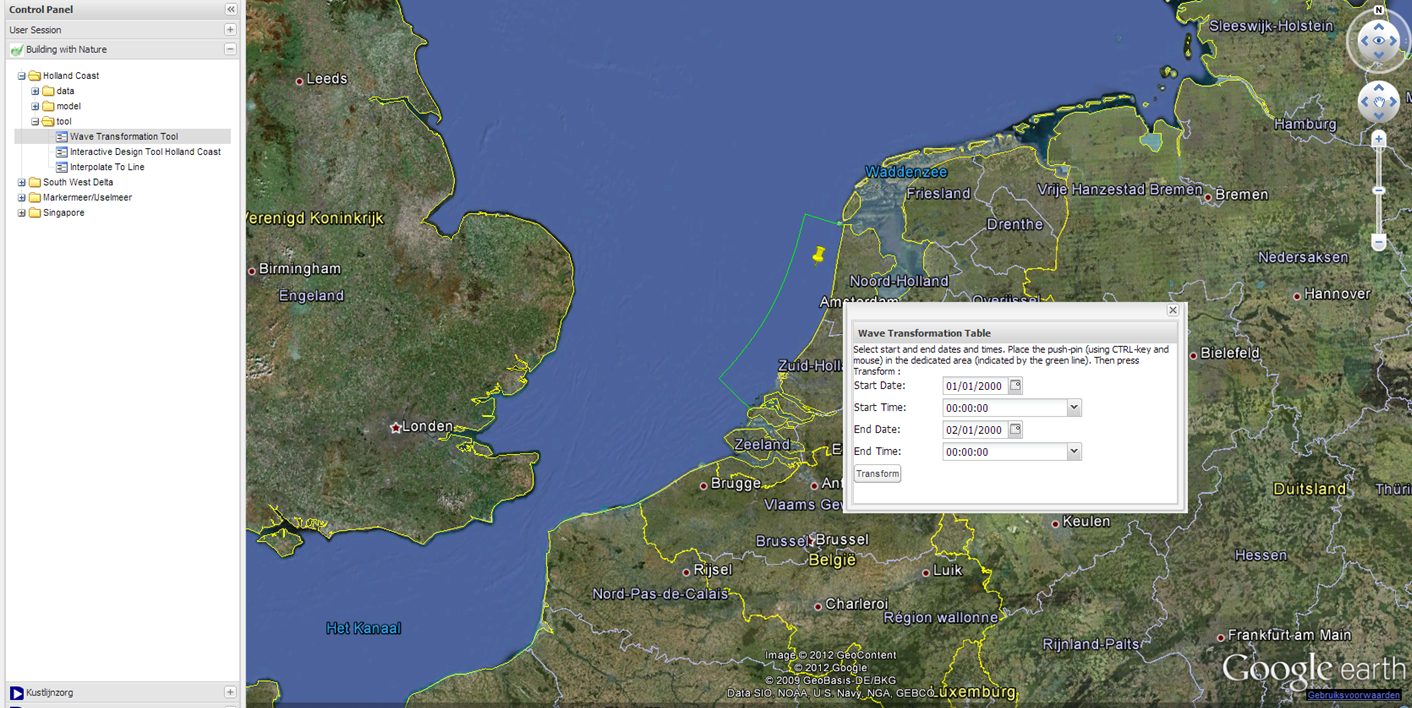
- Browse to viewer.openearth.nl, open the project Building with Nature, select the case Holland Coast and navigate to the tool Wave Transformation Table. A window should pop-up as indicated in the figure below.
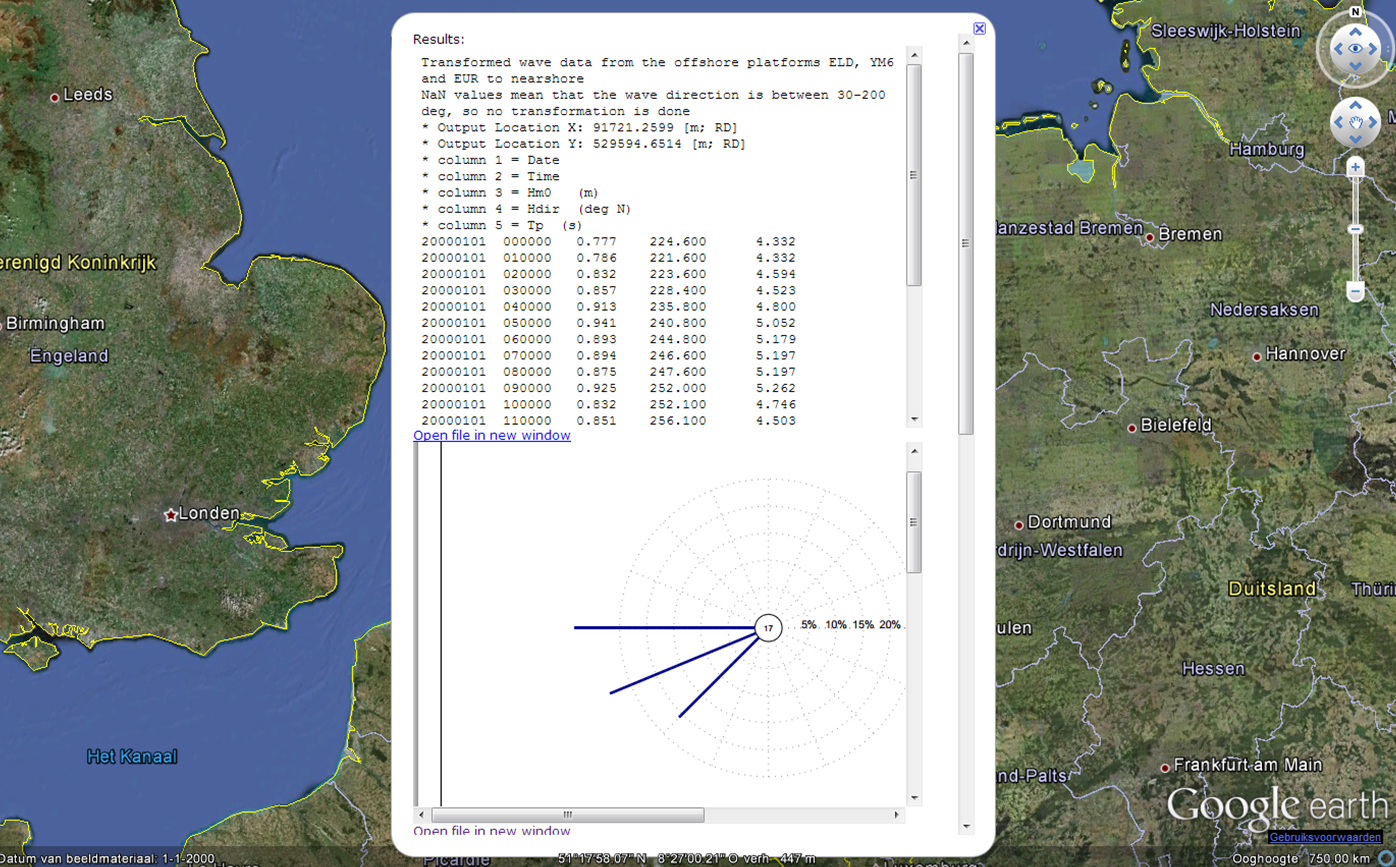
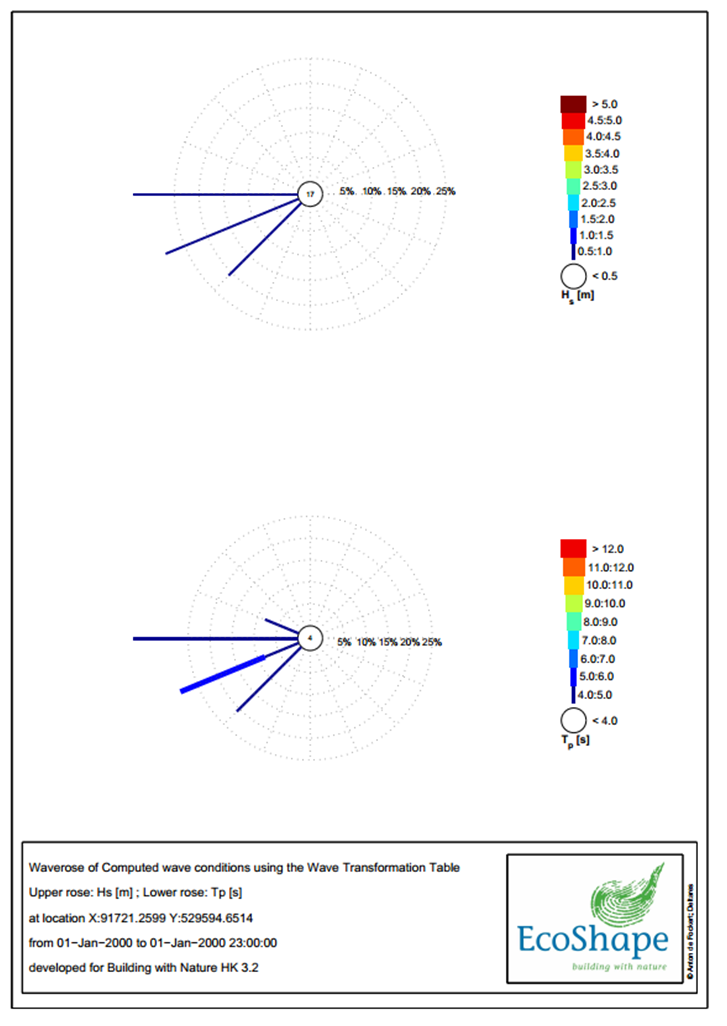
- Using the Ctrl-button and the left mouse button the yellow pushpin can be dragged to the place of interest. Please make sure that the pushpin remains within the area indicated by the green line, as this is the model extent. In the pop-up window the user can select the start and stop dates and times for the wave time series. When pressing transform, the tool will start to interpolate the wave timeseries to the point of interest. Depending on the length of the time period this may take a little while. Eventually, the results should pop-up as indicated in the figure.
- To open the individual results in a new window, please follow the link “Open file in new window”. Here, the user can also save the file.
- Scrolling to the bottom of the balloon with the results, the user will find background information on the set-up of the tool and the working principles. This document also contains validation information of the tool.
Working principles
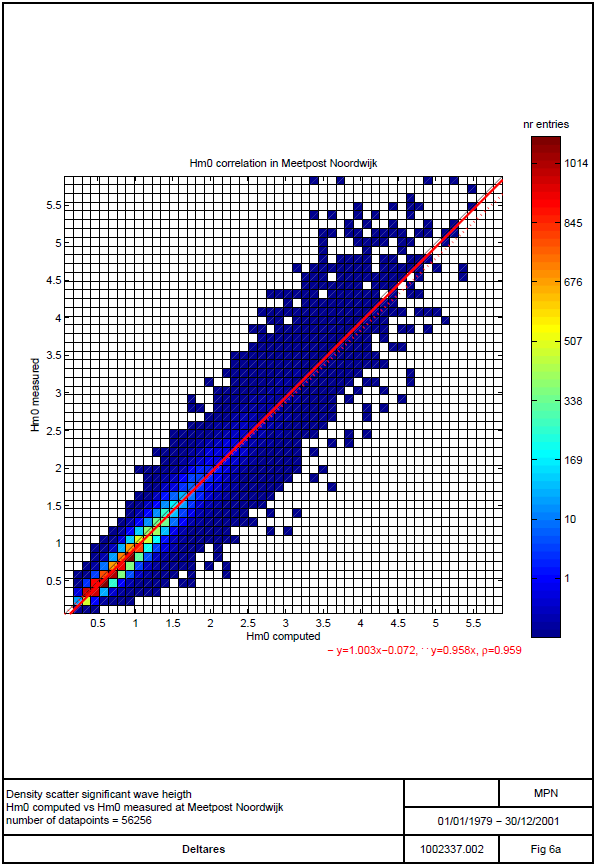
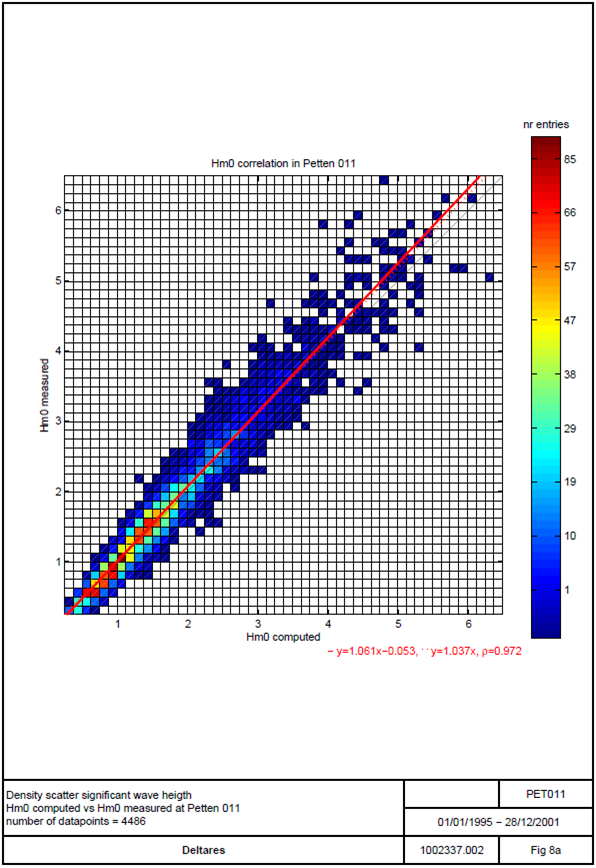
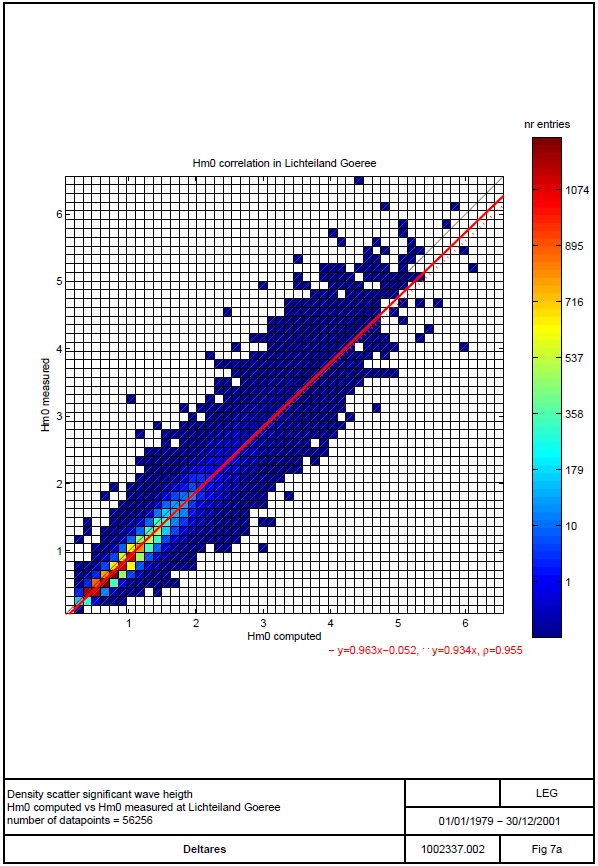
The Wave Transformation Table is based on wave time series measured at the stations IJmuiden, Eierlandse Gat and Europlatform 3 in the period January 1979 to December 2000. From the time series a set of wave conditions is derived that force a SWAN wave model in stationary mode. The results of the SWAN simulations are used to derive the Wave Transformation matrix. This matrix consists of factors that specify the relation between the offshore (model forcing) and nearshore (model results) wave parameters. With this matrix a wave condition offshore can be translated to any nearshore location. The offshore wave condition is obtained from one of the offshore wave measurements stations (depending on the pinpointed location relative to the offshore stations and the wave direction) based on the dates and times entered by the user. The Wave Transformation Table has been validated against measurements for the stations Noordwijk Meetpost (1979-2001), Lichteiland Goeree (1979-2001) and two stations near Petten (1995-2001), see the correlation diagrams for the significant wave height in the figures attached. The validation results typically show correlation coefficients in the order of 0.9 or higher for significant wave height, wave direction, peak period and surge, except for the stations near Petten where the peak wave period has a correlation in the order of 0.6. The lower correlation coefficient for Petten may be related to the relatively large number of extreme values in the time series, which may be outliers that have not been removed from the dataset prior to the validation.
Advanced Usage
To apply the technique underlying the tool to other coasts the following steps need to be taken:
- obtain (sufficiently long, i.e. typically more than 20 years) measured offshore wave time series in/near the coast of interest
- set up a wave model (for example SWAN) to transform offshore wave conditions to the nearshore
- run the model for a matrix of wave conditions and derive transformation factors
- write/ adjust the Matlab code (based on the locations of the measurements) to transform time series of offshore spectral wave parameters to nearshore based on the matrix
- link to an online database that regularly updates with recent time series (of spectral wave parameters)