Practical Applications
Fibre-optics are applied to monitor the morphological changes of an experimental sand nourishment on the shallow foreshore of the Workumerwaard, the Frisian coast of the IJsselmeer in the Netherlands. The goal of this pilot is to investigate potential strategies for revitalising the ecologically valuable wave-attenuating wetland in front of the primary flood defence, and see to what extent this enables this area to follow a gradual increase of the lake level. The effects of the nourishment on terrestrial and aquatic ecology are monitored, as well as the hydrodynamics and the changes in morphology.
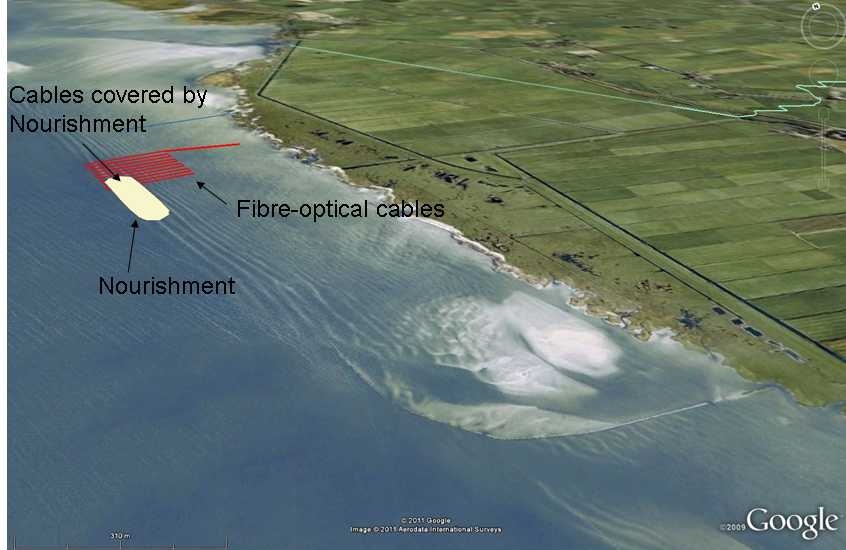
In order to correlate measured hydrodynamic and morphological changes on an intra-day basis, 4 kilometres of fibre-optical cable has been placed on the lake-bed in a 0.5 km2 horizontal grid. The grid is designed to capture the expected morphodynamics of the sand nourishment, which initially covered part of the grid covered. Using laser-based technology, an accurate temperature measurement was taken every two hours in every running meter of the cable. The difference in heat capacity between water and deposited sediment causes an attenuation of the water temperature signal, e.g. due to the daily variation of irradiation, where the cable is covered by sediment. As a result, the position of the nourishment and changes in its morphology can be monitored accurately, at a high space and time resolution. Since the monitoring is on an intra-day basis, individual hydrodynamic events can be matched with changes in morphology. The pilot does show that this innovative fibre optic method is an alternative for traditional echo-sounding and can be applied to high-frequency monitoring of erosion and deposition of sedimentary systems.
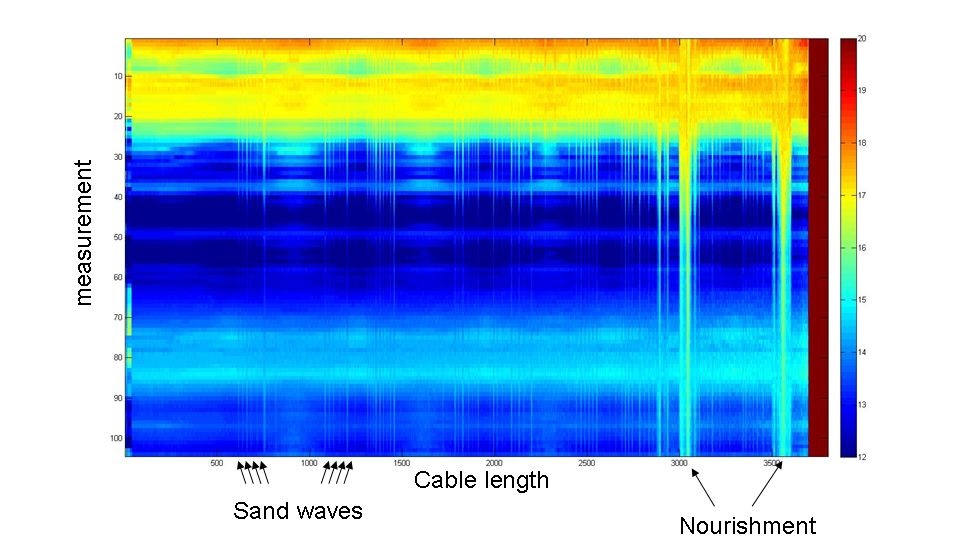
The first results of the monitoring program on the Workumerwaard are promising (see figure and videos). Daily changes in temperature and variations of temperature with water-depth are clearly visible. In addition, the exact position of sand bars as observed in the field and by air-photographs can be derived. The position of the nourishment is visible by the deviating temperature. Strikingly, dynamic sand bars form on top of the nourishment (Video 3). Yet, no clear movement of the nourishment itself can be derived from these data. This suggests that the nourishment is less dynamic than expected, at least during the period of time covered by the measurements. The sediment cover, as inferred from temperature measurements, will in a later stadium be validated with bathymetric measurements of the exact lake bed topography.