How to Use
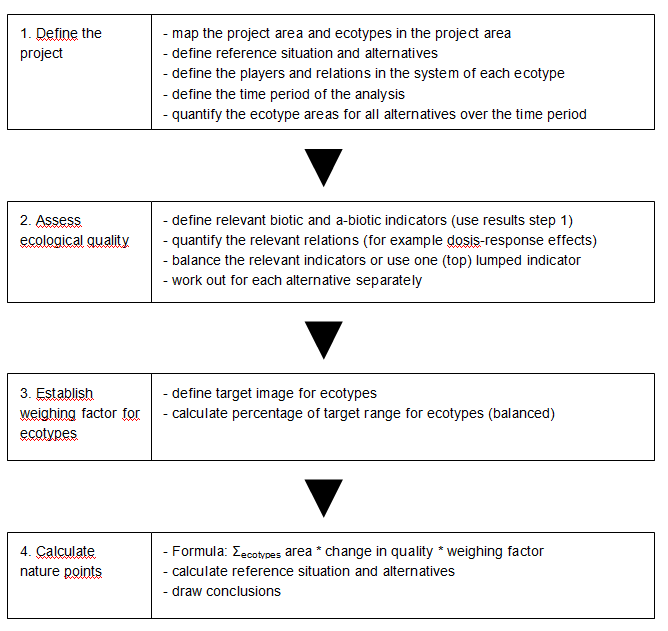
The Nature Index tool quantifies the change in nature value due to the design alternatives considered. In four steps, the tool translates the nature value into a quantitative score: nature points, where more points indicate a higher value:
- Defining the project
- Assessing the change in ecotope quality
- Weighting of different ecotopes
- Assessing the Nature Index
General information
The tool can be used in situations where the feasibility of a project has to be demonstrated or where the best (cost effective) alternative has to be chosen. Applying the tool requires ecological knowledge. The tool is based on an ecological system analysis with efforts to quantify as much as possible. One should be capable to program and operate a programme like Excel.
It turns out that the system analysis approach requires significant (research) efforts. At first sight, this may make the method less applicable to studies in the initiation phase of a project. Yet, during a project one always benefits from a sound ecosystem analysis, so for projects that survive the initiation phase the effort pays back. The system analysis produces all the information needed for a proper assessment. At first sight, this approach requires more input information than assessments based solely on target species, but note that the latter also require a system analysis.
Quantification of ecological effects has advocates and opponents. On the one hand it can lead to transparent information to support decision-making. However, it also points out what data is available, what information is lacking and what assumptions have to be made. A method like the nature index tool is vulnerable for criticism, as it explicates the information that is missing and that had to be filled in with expert judgement. The more qualitative approaches do have to deal with the same lack of information and uncertainty in evaluating the effects. But these methods have more margin in presenting the results.
Phases to determine Nature Index
Step 1: Defining the project
Step 1 provides the basis for the further analysis. It results in a map of the project area that shows the relevant ecotopes. Step 1 consists of the following sub-steps:
1a) Mapping of the project area and its ecotopes. The project area includes all areas that are positively or negatively influenced by any alternative. The project area is not necessarily continuous, but may consist of separate patches in the landscape. The project area should be the same for all alternatives, in order to be able to compare their nature indices. To define ecotopes in the project area, legislative documents are the starting point. In Europe, these are the Water Framework Directive, Natura 2000, or national legislation derived from these European frameworks. These documents are the preferred basis for nature indexing since they provide a shared and broadly accepted frame of reference. When information from these documents is not sufficient, not available, or reasons exist for not using it, expert judgement may be used to complete the information. In that case it is strongly advised to organize expert meetings, in order to have the ecotope definition commonly accepted. If alternatives affect ecotopes that are not mentioned in legislative documents, they should also be included in the analysis. If only a part of an ecotope is affected, we recommend to split this ecotope into two: a) the ecotope affected, and b) the ecotope not affected. Finally, visualization clarifies matters for discussion and ensures that the entire project area is covered with ecotopes.
1b) Defining the reference situation and design alternatives. The nature index study considers a number of predefined design alternatives and the reference situation. In most cases the reference situation is the current situation plus the expected autonomous development. The definition of the latter may be non-trivial, especially if other projects are foreseen in the area. Depending on the type of project, design alternatives may lead to a wide variety of ecological effects within the project area. When defining these alternatives it is important to consider the availability of ecological information, such as species numbers, soil parameters and cause-effect relations. Doing so in the very beginning of the design process yields a first estimate of the scale of the nature index study to be carried out.
1c) Defining the system components and relations for each ecotope. Each ecotope is a dynamic system of which the main components and their interrelations and interactions need to be identified and understood. Based on this understanding, it is possible to indicate which effects influence which ecotope quality and to what extent. As this approach treats ecotopes as dynamic systems, it reaches beyond merely satisfying the legal obligation to protect certain species. In addition to the system identification, the driving abiotic factors need to be identified. Natural drivers such as tidal fluctuations and water currents, but also human activities such as nutrient loading or nature management, should be included. Also the time-variation of these abiotic factors, either autonomous or in response to the project, needs to be known.
1d) Defining the time period of the analysis. t=0 is the start of the project, which mostly coincides with the implementation of measures or structures. The time period ends when all effects have materialised, or (for practical reasons) after a maximum of 100 years. Besides permanent effects, a project may causes significant temporary effects. The nature index takes both into account.
1e) Quantifying the ecotope areas per alternative and time period. The area of each ecotope has to be calculated (in hectares) and serves as the basis for the attribution of nature points. The ecotope areas have to be determined for the reference situation and for each design alternative considered. Make sure that the totals add up to 100% of the project area.
Step 2: Assessing the change in ecotope quality
In this step, the time-evolution of the ecotope quality is assessed. This step is probably the most challenging and complex of the tool. The quality of an ecotope may change autonomously or in response to the project. Step 2 consists of the following sub steps:
2a) Determining the quality indicators per ecotope and their state for a 100% intact ecotope. One measure for the quality of an ecosystem is biodiversity (the presence of species). In an international context, considerable effort has been put into standardisation of indicators of biodiversity. UNEP has developed the Mean Species Abundance as an indicator of the quality of ecosystems. The method is based on a widely accepted set of species characteristic for an ecosystem. The nature index tool uses a localised version of the Mean Species Abundance: for every local ecosystem one can define the species that are able to or supposed to live in that system (see also Sijtsma et al. 2009). The Nature Index tool expresses nature quality per ecotope in percentages. A nature quality of 0% reflects absence of species, while a nature quality of 100% reflects abundance of species matching a healthy or intact ecotope. The healthy ecotope is the desired quality of the ecotope and serves as a reference.
To define indicators and their potential value (= intact ecotope), we take legislative documents such as the Water Framework Directive, Natura 2000, or national legislation derived from these European frameworks as the starting point (see step 1.1 for argumentation). The nature index tool is flexible with the level of detail of indicators, e.g.:
- specify one lumped indicator that reflects the quality of the ecotope (in relation to the project goal), or;
- specify indicators directly related to the project goals only, or
- assess the status of the complete ecosystem. In this case it is advisable (for workability) to categorise the indicator species in species groups and take the average of the quality per group. For an example, we refer to Wortelboer (2010) who performs an analysis of nature quality of the Dutch saltwater systems. He categorises the indicator species in the groups phytoplankton, benthos, fish, birds and mammals.
2b) Determining the required input values for the indicators for different design alternatives. Estimating the current or future quality of an ecotope is often difficult. Note that the absolute value of ecotope quality is not the most important information. More relevant are the relative quality differences between alternatives. One of the most challenging issues with indicator valuation is the fact that it should also be valid in the future, with and without a project. Predicting the effect of the autonomous development and the project on the quality of species, such that alternatives become comparable, requires expert judgement and, where possible, modelling. There is a great variety in modelling tools with regard to ecological processes. For every case or plan area, the selection of suitable tools can be different. Moreover, these modelling tools are very actively being invented, renewed and improved. A summary of the currently existing, useful models is described in the STOWA report (2009). Here, Excel is used as a modelling environment. In addition, information from other tools, such as the dose-effect relations from Deltares HABITAT can be used to describe the interrelations between species groups and the changes of the abiotic parameters over time.
2c) Estimating the current quality of each ecotope (%) and the change in quality over time. The quality of the ecotope at the end of the time period reflects the permanent effects of the project. In addition, temporary effects may seriously affect an ecotope for some time, after which it may recover. To express these effects – and thus enable comparison between alternatives – the Nature Index tool assesses the quality of ecotopes over the complete time period.
Step 3: Weighting of different ecotopes
Step 1 and 2 define the relevant ecotopes in the project area and their quality state, irrespective of their relative importance. Some ecotopes represent a higher nature value because they have a higher biodiversity or include rare species. In the nature index tool, these elements have to be accounted for. For example, changing a precious intertidal area with low-quality brackish water into a widespread deep area with high quality sea water would be beneficial in such an index. Therefore, the nature index tool has to correct for rarity and/ or larger-scale biodiversity. If we don’t take the relative value of ecotopes into account, undesired effects may occur.
For terrestrial ecotopes different weighting factors are determined, based on the presence of rare species and biodiversity (Sijtsma et al, 2009). ecotopes get more weight if they include species that are not hosted in (most) other ecotopes and they get more weight if they host a lot of different species (high biodiversity). These weighting factors balance the ecotopes at a larger scale and make nature point values comparable across projects. It is not possible to use this system for aquatic ecotopes, as the data to determine rarity and biodiversity are lacking. For aquatic ecotopes one therefore has to work with a local weighting system. Such a system works on the basis of indicators that account for the relative abundance of ecotopes in the project area. When an ecotope diverges extremely from the target situation (e.g the historic reference situation or the policy objective), than it should be weighted with a relatively high factor.
The use of local weighting factors requires the definition of a so-called target situation, i.e. the ecological situation that we strive for in the project area. It can be the same as the ‘natural’ situation, but not necessarily. In some cases human intervention cannot be completely overcome. For example, the storm surge barrier affects the ecological conditions in the Eastern Scheldt estuary significantly. Yet, the barrier will not be removed because of its coastal protection function (if it would be technically possible to remove it, at all). This should be taken into account when defining a realistic ecological target situation for the estuary. In Europe, the target situation can be abstracted from existing legislative documents like the Water Framework Directive.
| target situation (%) | current situation (%) (part of step 1) | weighing balance | |
|---|---|---|---|
| ecotope X | … | … | … |
| ecotope Y | … | … | … |
| ecotope Z | … | … | … |
| total | 100 | 100 |
When the (local) weighting factor is established by means of deviation from the target situation, the weighting factor can change over time – for example when the area of the ecotope changes over the years. In that case a new weighting factor has to be calculated (i.e. a new comparison with the target situation).
Step 4: Assessing the Nature Index
With all the data generated – area, quality index and weighting factors – it is easy to calculate the nature points as the formula only multiplies the elements:
Σ relative area per ecotope * index ecotope quality * weighting factor
(where Σ denotes summation over all ecotopes in the plan area).
| 2011 | 2012 | 2013 | 2014 | 2015 | 2016 | 2017 | 2018 | 2019 | 2020 | 2021 | etc. | |
|---|---|---|---|---|---|---|---|---|---|---|---|---|
| area ecotope X | ||||||||||||
| area ecotope Y | ||||||||||||
| area ecotope Z | ||||||||||||
| quality ecotope X | ||||||||||||
| quality ecotope Y | ||||||||||||
| quality ecotope Z | ||||||||||||
| weighting factor X | ||||||||||||
| weighting factor Y | ||||||||||||
| weighting factor Z | ||||||||||||
| total |
The nature points are calculated for the reference situation and each design alternative. In principle the nature points are calculated per year (as the scheme for calculating nature points illustrates). The question is how to determine nature values for the whole time period from these yearly ones. There are two options:
- by adding up the yearly results;
- by discounting and determining a ‘net present value’.
The second option is more familiar to economists than to ecologists. By discounting one takes into account that short-term effects are preferred over long-term effects. Discounting also reflects the uncertainty whether the rated effects will materialise. A high discount rate therefore corresponds with a strong preference for short-term effects and a high uncertainty. Although in principle there is nothing wrong with discounting ecological effects, it seems too far fetched for current nature valuation practice. Moreover, there is no accepted practice to determine realistic discount rates.
Recommendation and Advice
A major challenge in the process of nature valuation is to determine the necessary level of detail, especially in the assessment of changes in ecotopes and ecotope qualities. This requires thoughtful consideration before carrying out the actual analyses. The challenge is to find a balance between the necessary detail for proper representation of the system and the data, time and money available for the analysis. This level of detail will be different for each case, but in general ecotopes, species groups and driving abiotic parameters need to be included to allow for the execution of the above described steps.