Operation and Maintenance
The pilots are intended to gain knowledge of the system, therefore appropriate monitoring is essential. The monitoring is focused to gain a better understanding of:
- Effects on the coast
- Effects on ecology (above and below water)
- Behaviour of the sand engine
- where the sand travels
- how fast the sand travels
- what (weather) conditions is dominating the observed changes
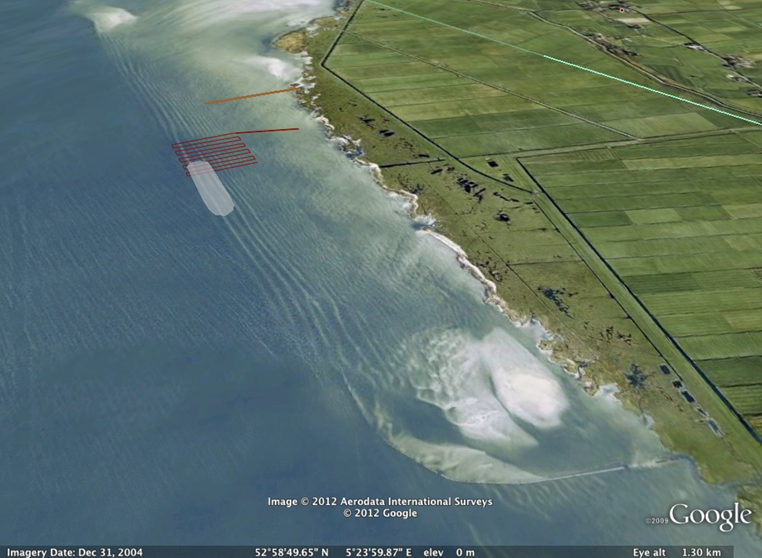
An overview of the nourishment location and monitoring aspects for the Workum sand engine can be seen in the picture above. The red line is a dam made from wooden poles. The location of the fibre-optic grid is also indicated.
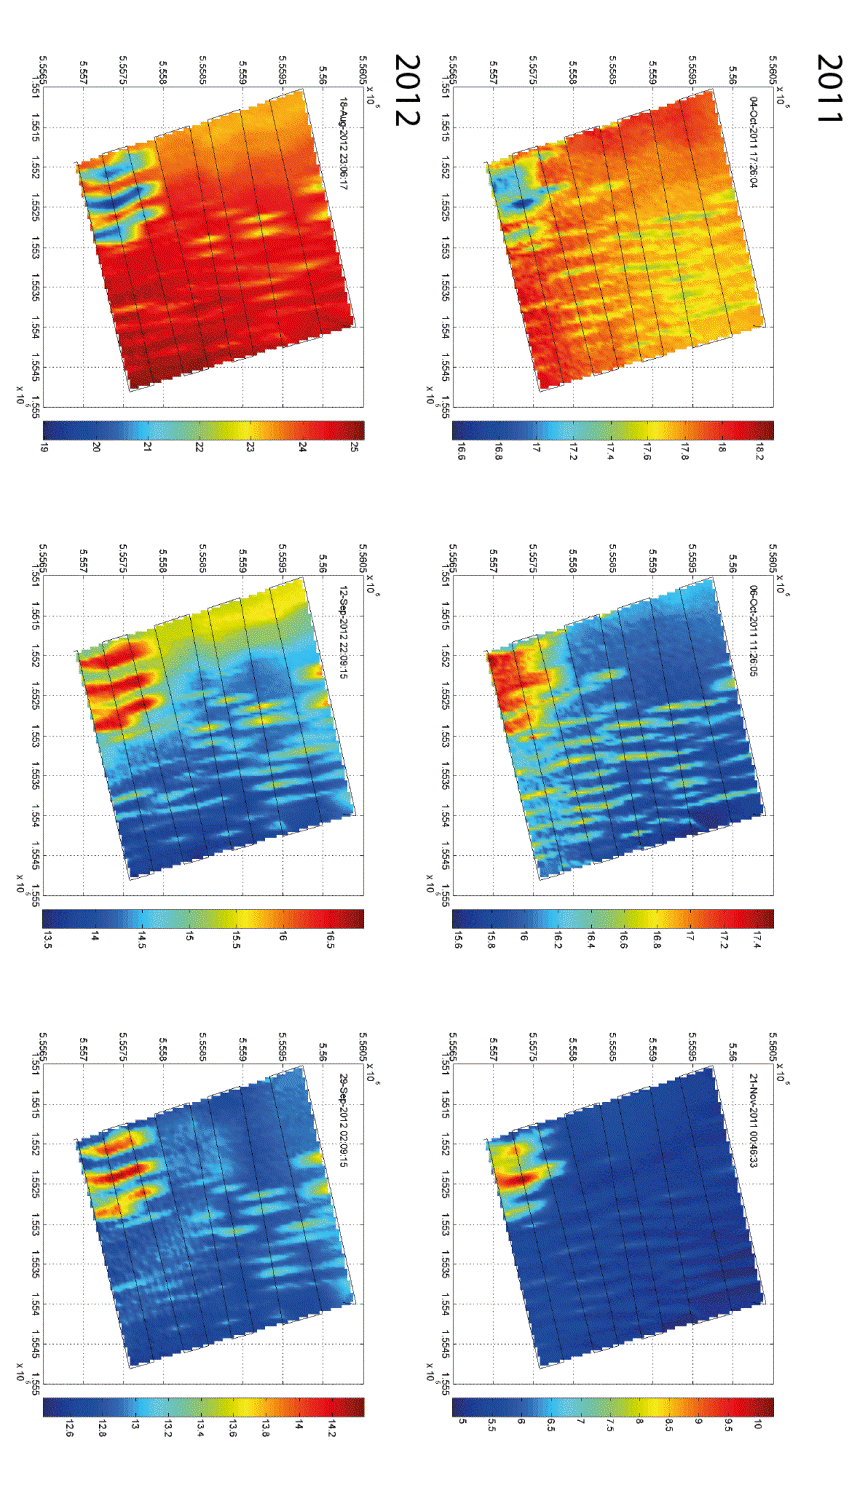
The morphological changes around the sand nourishment are followed in detail by measuring land elevations with LIDAR, and underwater bathymetry with DGPS and single beam sonar readings. These measurements show how and where the sand is moving. In Workumerwaard, there is also an innovative experimental set-up used with 4 kilometre of fibre-optic Distributed Temperature Sensing (DTS), which allows us to follow the morphological changes near real-time. The results up to 2014 in the Workumerwaard demonstrate that the sand moves parallel along the shore, and the nourishment takes the shape of the sand ridges that were there before. So far, no effect of the sand nourishment was observed on the coast. The fibre-optic DTS measurements show that these have great potential to follow morphological changes in high temporal detail. The results in Oudemirdum show that the sand there is moving in line with expectations. In the picture you can see the spatial interpolation of fibre-optic DTS temperature data of 6 separate temperature measurements. The upper panels are from 2011, the lower panels are from 2012. The temperature anomaly on the lower left reflects the position of the nourishment.
At both locations, no major differences in underwater vegetation between control sites and nourishment sites are observed so far. Both pilot locations provide important data sets that can be used to calibrate morphological models.
Research on the governance aspects is focused on the lessons learned to scale up the application of such a sand engine, and simultaneously to create realistic expectations.