Operation and Maintenance
1.Monitoring and evaluation
The construction of a soft sand engine on the coast of the Workumerwaard is an important pilot project, aiming at several objectives (It Fryske Gea, 2011):
- To increase coastal safety by reducing wave attack on the dike and reducing or even stopping coastal erosion.
- Adaptation of the vegetation to morphological changes on the shore face and onshore and to the clearer and calmer waters in the lee of the nourishment.
- Insight into the wave-attenuating effect of the sand nourishment in relation to the coast during storms.
- Insight into the pathways of the nourished sand, into deeper water as well as towards the shore.
- Insight into and predictive capability of morphological developments in response to a sand nourishment offshore of a vegetated foreshore; one question is whether the nourished sand will segregate (according to grain size) when being transported, as this may influence vegetation development.
Several techniques have been used to monitor morphological changes and sediment dynamics in the area: LiDAR land surface elevation modelling, bathymetric surveys and fibre-optical measurements.
2.LiDAR height model
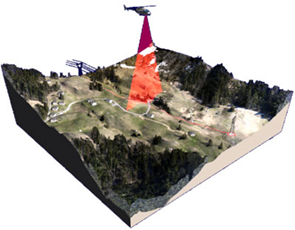
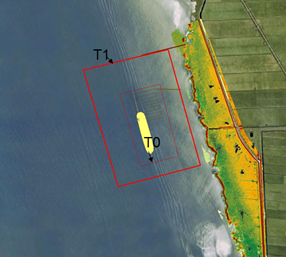
LiDAR is short for Light Detection and Ranging, an optical remote sensing technology that can measure the distance to – and therefore the height of – an object by illuminating it with light and measuring the reflection, often using pulses from a laser. To monitor morphological changes to the coastal zone – in this case including the effects of the sand nourishment – every year a height map is generated using LiDAR. A helicopter flies over the area generating a map using the laser pulses reflected by objects below (figure 2). As this technique is unable to penetrate a water body (laser reflects on the water surface), morphological changes of the lake bed cannot be monitored.
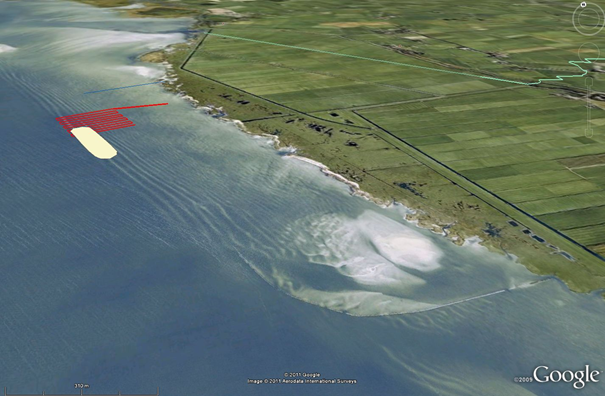
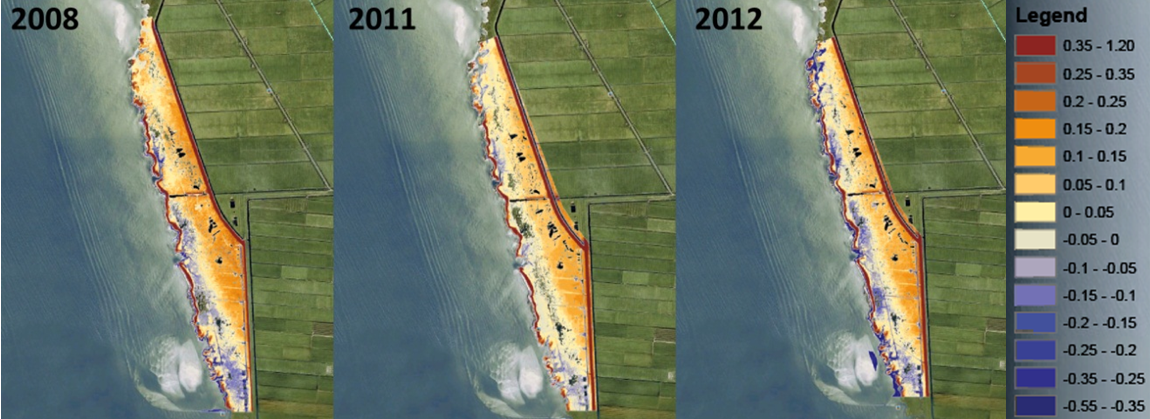
In the context of the soft sand engine pilot, the first LiDAR maps have been generated in February of 2011 and 2012, and the water board Wetterskip Fryslân has provided similar images from February 2008. The figure below shows the LiDAR height images of three different years. Note that, because the sand engine is constructed below the water surface, it is not visible on these images. Legend; height in m.
More interesting than height images at different points in time are the differences between them. The figure below shows the LiDAR images of the height differences between the years 2008 and 2011 (left) and 2011 and 2012 (right). Legend; height differences in m.
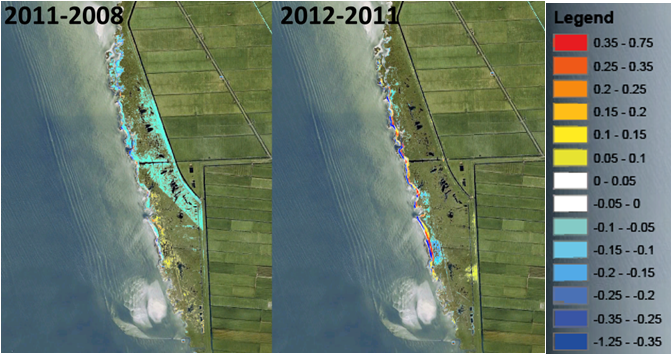
The height differences are most likely caused by the transport of sediment. The difference in land surface elevation between 2008 and 2011 is very limited. Some areas are slightly decreasing, some areas, particularly in the south are slightly rising. The limited sand dynamics in this time period suggest that the system has been relatively stable over the years. However, the dynamics are much more apparent in the period between 2011 and 2012. Results of the LiDAR map show coastal erosion, reflected by a retreat of the beach ridge. This retreat of 10 up to 25 meters was probably the result of one storm event in the first week of 2012. So far, no effects of the nourishment can be derived from these images.
3.Bathymetric survey
To get a complete picture of the morphological changes in the area, it is important not only to look at changes above the water level. The bathymetry needs to be monitored as well. In the case of the soft sand engine Workumerwaard a jet ski with echo sounder has been used to measure the lake bed elevation. The interval from the emission of a pulse to reception of its echo is recorded, and the depth calculated from the known speed of sound through water. Where waters were too shallow for the usage of a jet sky a DGPS device has been used that could be used when walking. All bathymetric measurements have been conducted by a company – Shore Monitoring – specialized in shallow water surveys. Several surveys have been made. T0 is the lake bed before construction of the soft sand engine, acquired in April 2011. The measurements following the creation of the sand bank – T1, T2, … Tx – cover a larger area in order to cover all changes.
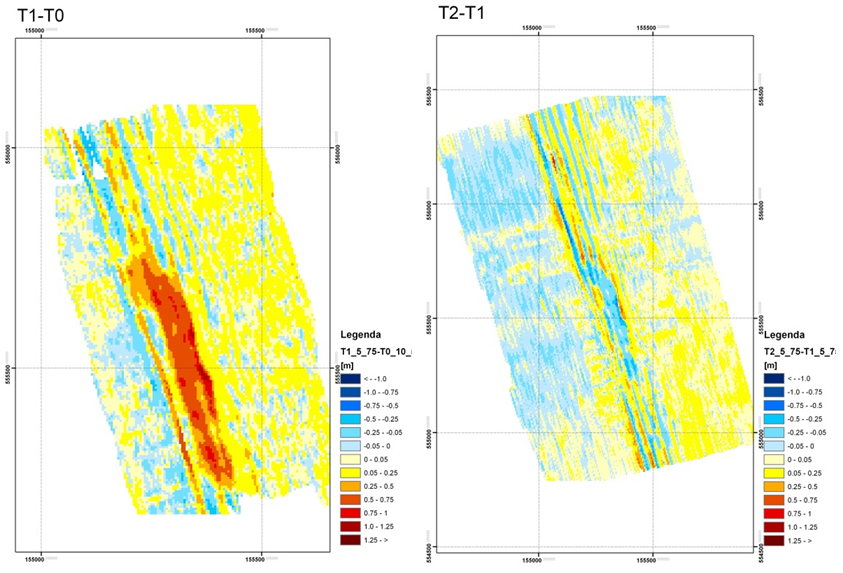
The results of the measurements are shown in the figure below. In the T1 bathymetry grid, acquired immediately after the placement in October 2011, the sand nourishment is clearly visible as an elongated shallow structure. The top of the nourishment lies around NAP 0 m. The difference between the T1 and T0 measurements also clearly shows the location where the sand was placed. Around this elongated structure, scattered anomalies show in general shoaling of the shallowest parts, and deepening to the north of the nourishments. The anomalies are however minimal and may be the result of measuring artefacts.
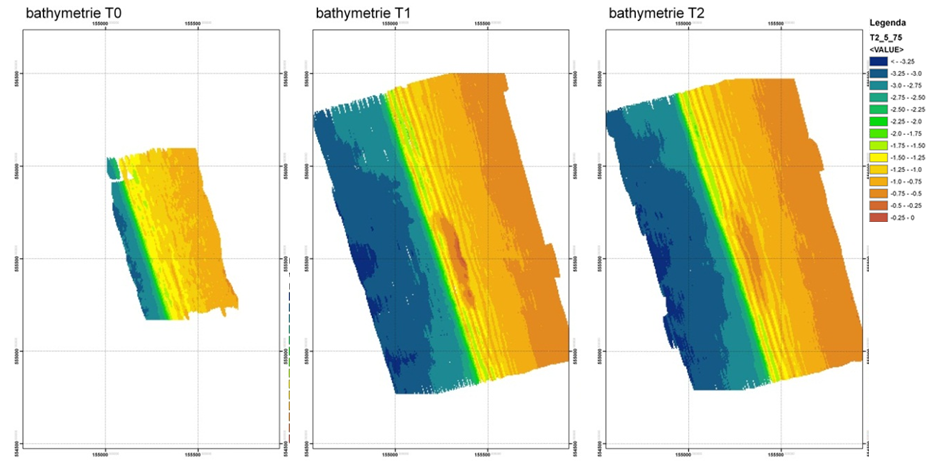
After the first autumn and winter storm season, the T2 bathymetry was acquired in April 2012. The resulting grid shows that the nourishment has lost height and become less pronounced. The difference between the T2 and T1 data (figure 8) shows that immediately coastward of the nourishment an increase in elevation is present. This suggests a landward transport of sediment. Furthermore, the largest changes in elevation are along the zone with the most pronounced sandbars at the lake side of the shallow water area.
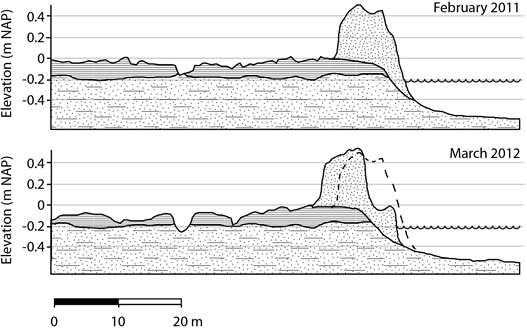
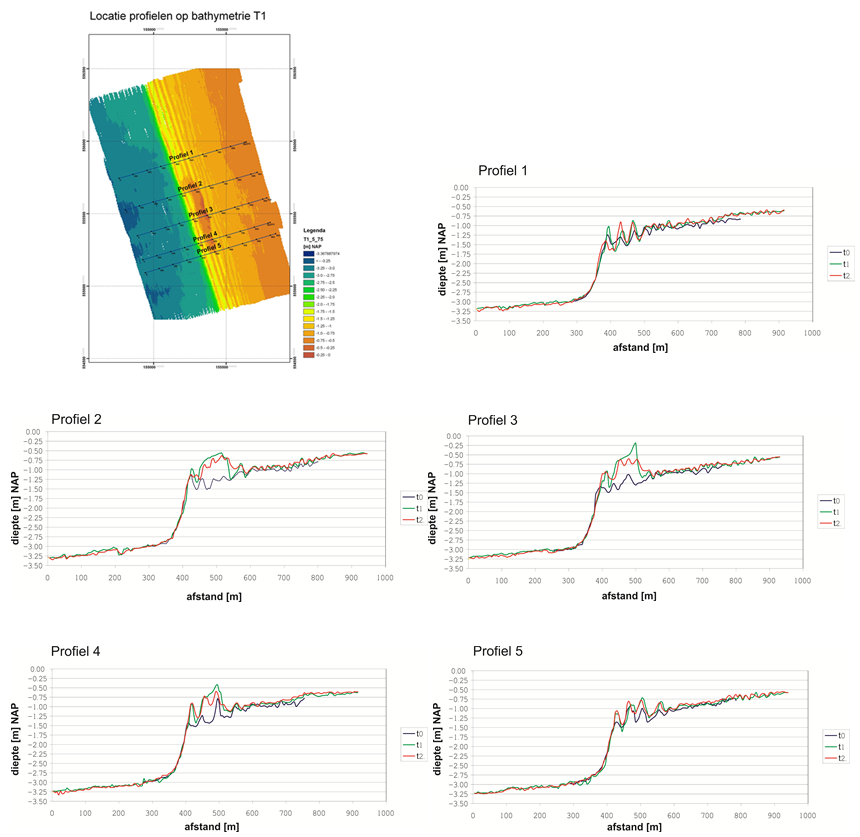
To further analyse the observed changes in bathymetry, elevation profiles were drawn across five sections of the nourishment. The cross sections show that immediately north (Profile 1) and south (Profile 5) of the nourishment, the sandbars appear to be more pronounced in T1 and T2 in comparison with the T0 data. The profiles across the nourishment show the fresh nourishment in the T1 measurements with a sharp crest on the landward side. The T2 data show the erosion of the higher parts, and the formation of sandbars on top of the nourished sand. Also the landward transport of the sand as a result of the flattening of the nourishment is clearly visible (Wiersma, 2012 in prep).
4.Fibre optic distributed temperature sensing
In the area north of the sand bank a grid consisting of a 4 km long zigzagging fibre-optical cable has been constructed. Part of this grid is covered by the sand bank. Using laser technology it is possible to measure the temperature in each metre of this cable with a time interval of about two hours. As sediment has a lower heat conductivity than water, parts of the cable covered with sediment will yield a different temperature signal than parts that are not covered at all. Also, the thickness of the sediment layer on top of the cable will influence the temperature signal. Based on this difference in temperature signal the location and thickness of the sediment layer can be calculated. This technique and its results are described extensively in the tool page on fibre optic distributed temperature sensing.