How to Use
This tool is easy to use for rapid assessments of the expected direct environmental effects of dredging operations. The user interface is easy to use and enables defining and evaluating different dredging scenarios. Clearly, the proper interpretation of results requires a certain level of knowledge on dredging operations, ecology and the models and databases underlying the tool. This sections provides more details on the following:
- Requirements
- Working Principles
- Functioning of the IDPT protoype version
- Developing a case with the IDPT
- SWOT Analysis
- Lessons Learned
1. Requirements
The IDPT is available as a stand-alone tool locally installed on the user’s PC to be used for the planning of dredging operations. Installation of Python, Pylons, the Matlab wrapper and Matlab is required.
2. Working principles
The working principles of the IDPT can be described with the steps of the workflow. The technical workflow diagram in the figure below shows the relations between the different modules.
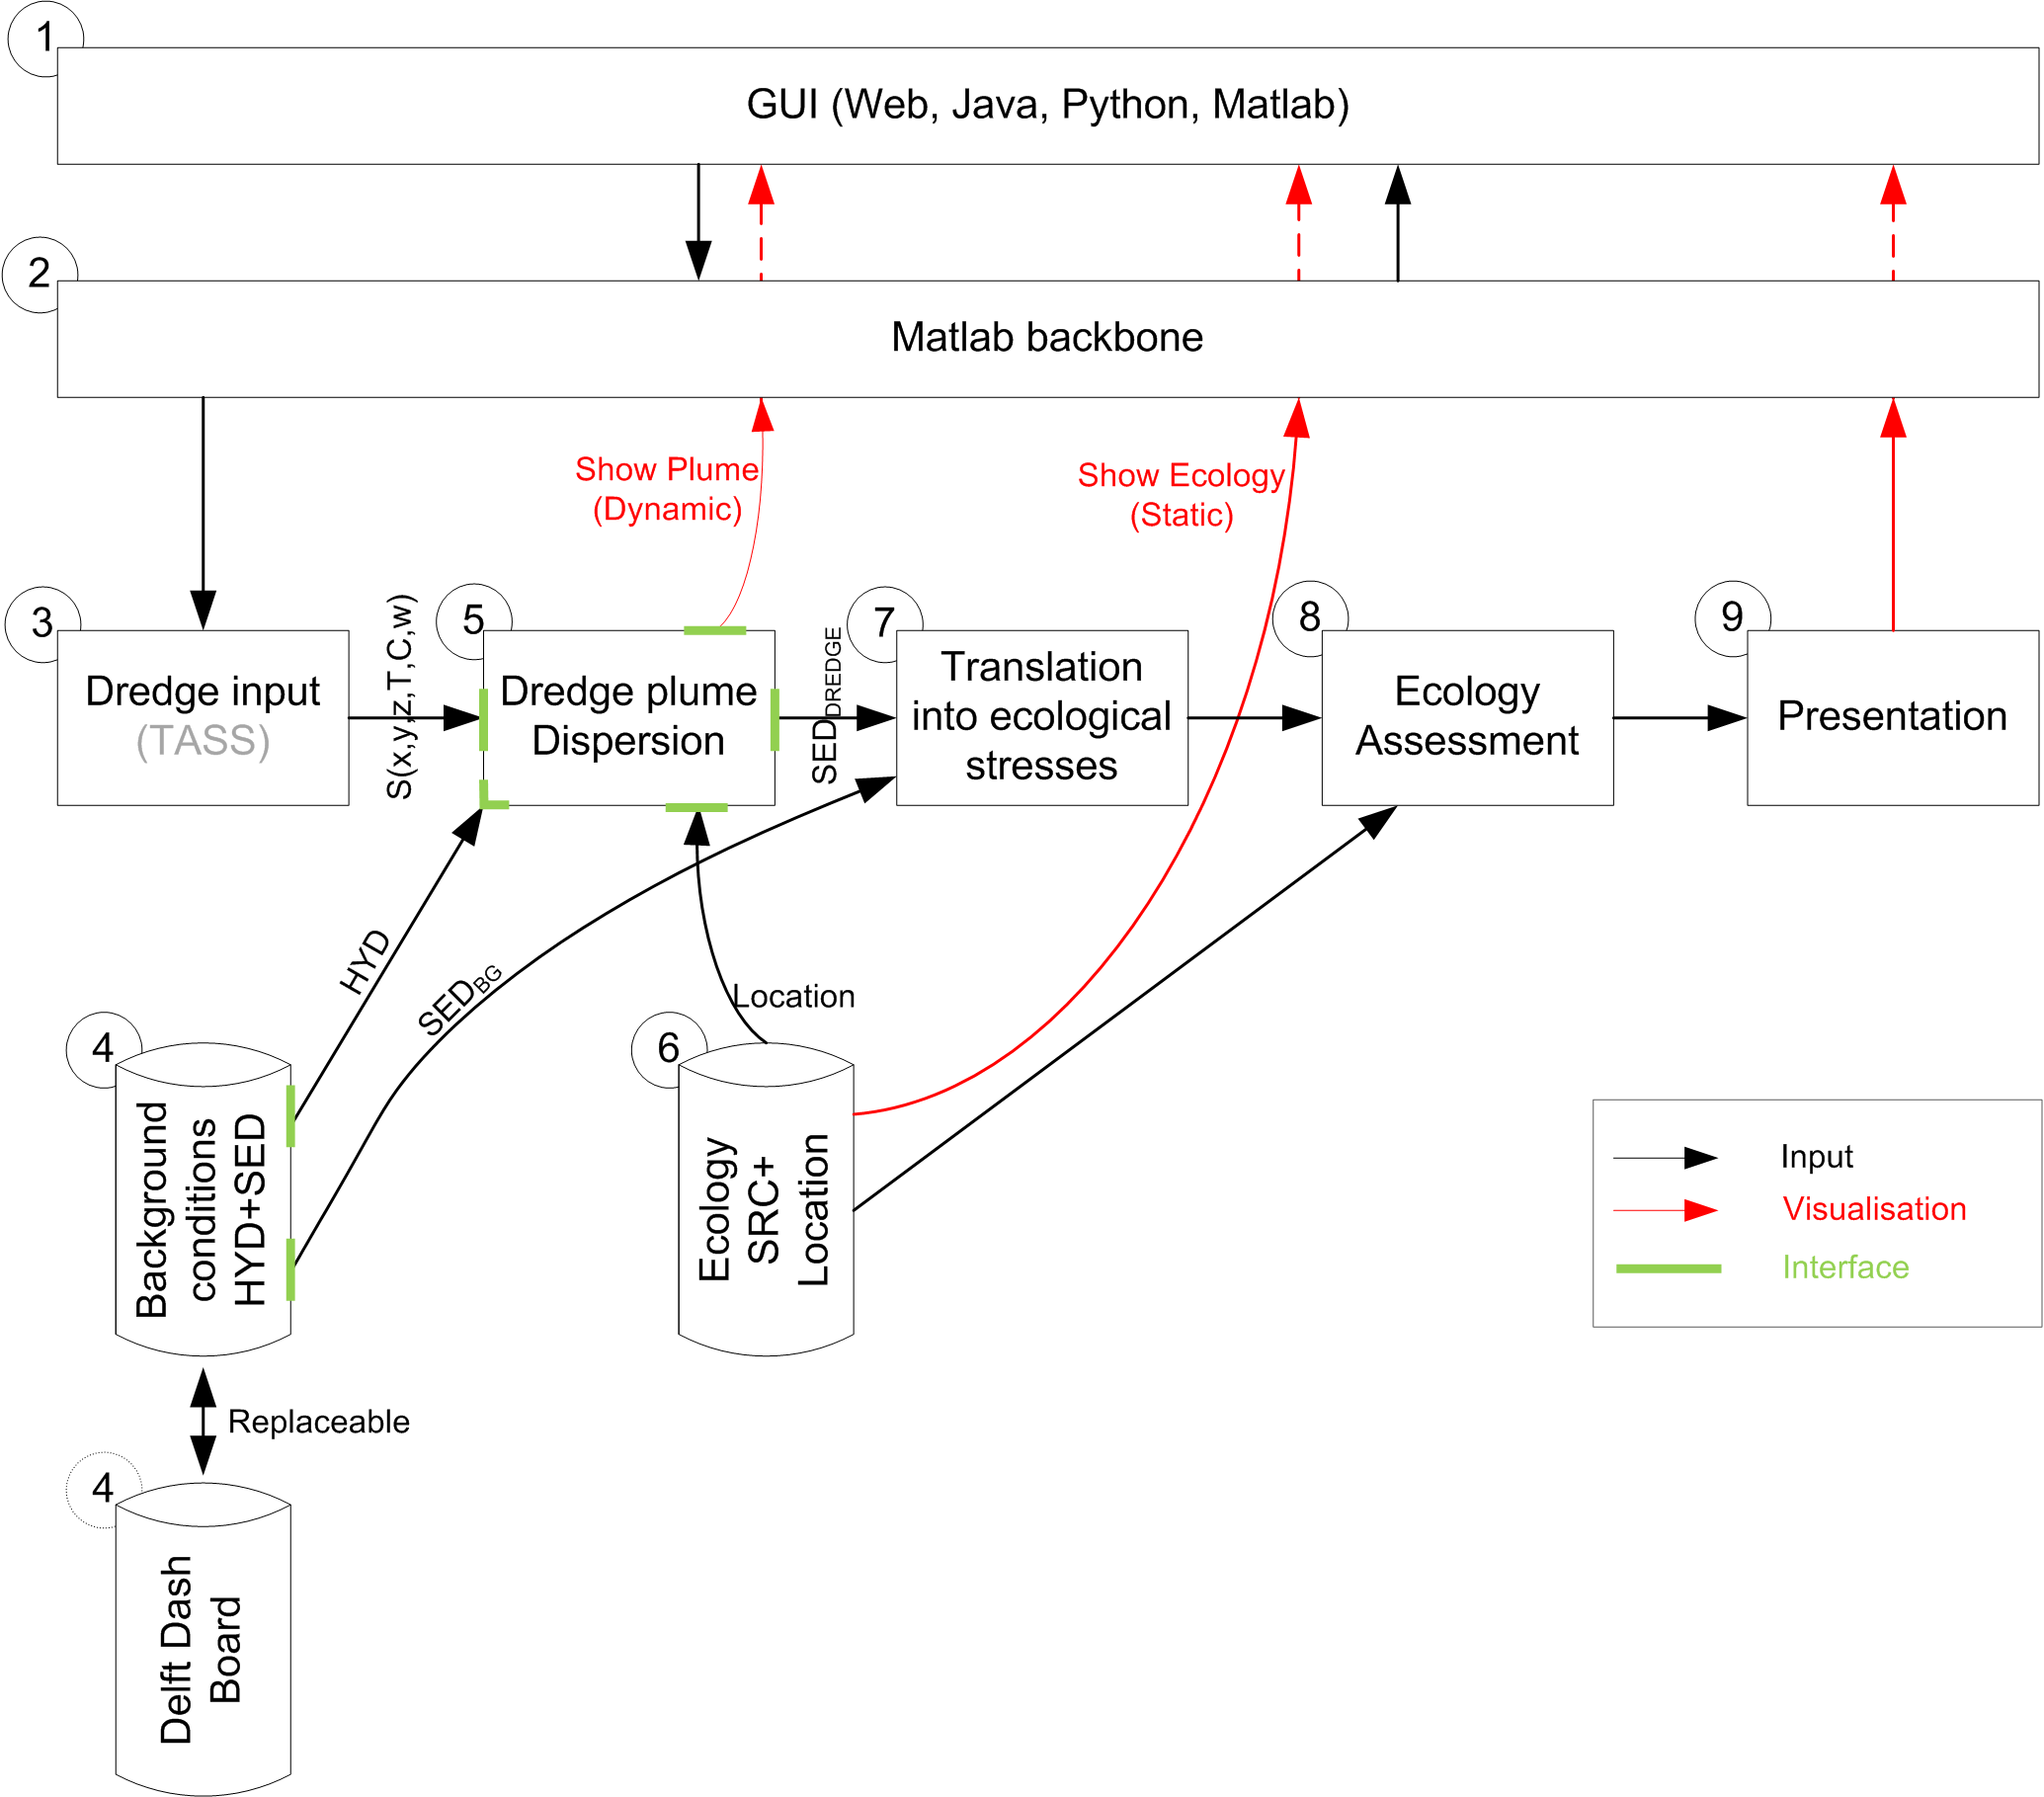
Workflow diagram of IDPT tool modules
- User interface
Users can specify the input in the user interface. The user interface contains a Google Earth plug-in in which the dredging tracks can be drawn and in which the results are visualised. - Matlab backbone
The Matlab backbone is the basis of the communication between the different modules and between the user interface and the modules. - Dredge input
The dredge input module translates the user input to input for the dredge plume model. In future, this module can be replaced by a Turbidity Assessment Software. - Hydrodynamic and suspended sediment background conditions
The background conditions corresponding to the selected ambient conditions will be obtained from a location-specific database with hydrodynamic and suspended sediment background conditions. This database is used by the dredge plume dispersion module, which should be able to read the database. Because the present used dredge plume dispersion model is Delft3D part, the database should be developed with the software package Delft3D and be able to couple with Delft3D part. In case a different dredge plume dispersion model is used, different requirements for the database will apply. - Dredge plume dispersion
The dredge plume dispersion module simulates the sediment plume dispersion under the influence of the prevailing currents. Detailed output is obtained for the locations with a vulnerable ecosystem. - Ecological input
The ecological input module contains a database with the locations of vulnerable ecosystems and the associated species response curves or other available criteria. - Translation into ecological stresses
This module translates the increased turbidity and sedimentation into ecological stresses, such as light attenuation. - Ecological assessment
The ecological stresses due to the dredging activities can be compared with the background conditions, if relevant. The expected stresses are translated to effect regimes via the species response curves (SRCs). The result is a map of the ecological effects of dredging activities. - Presentation module
The presentation module visualises the results of the dredge plume modelling and the ecological assessment in the Google Earth interface.
Note that different types of ecological criteria can be part of the IDPT, such as the mentioned SRCs. Also other ecological can be used, or non-ecological ones such as criteria related to territorial waters between countries. Criteria can simply be added to the database and assessment modules described above.
3. Functioning of the IDPT prototype version
This section describes how in general the user can work with the tool.
- The user specifies the required input parameters of the dredging operation (location(s), schedule, sediment characteristics, spill rate, etc.) and selects the pre-computed hydrodynamic ambient conditions scenario (e.g. normal conditions, storm, a particular season, anomalies), which is stored in the hydrodynamic database. The hydrodynamic database in the prototype IDPT consists of the validated Delft3D-FLOW Singapore modelling results. This means that the hydrodynamic model computations do not need to be carried out in the rapid assessment (since the dredge plume does not substantially affect the overall hydrodynamics), but only the sediment dispersion with the Delft3D-PART particle tracking model. Within the hydrodynamic database, other site-specific information such as the bathymetry is included as part of the hydrodynamic modelling input and results. The location(s) of the dredging operation can be defined interactively, e.g. by drawing points or a polygon on the map (white line in the Example screenshot of the IPDT). In the prototype version of the tool, the sediment spill rate and characteristics of the dredging operation are entered manually, see for more information the set-up guideline. For the prototype, the source terms are specified directly, i.e. in S(x,y,z,t) (kg/s). A more detailed coupling with a dredging operations model can be developed at a later stage to derive these source terms more comprehensively.
- When the required input has been given, the sediment plume model embedded in the tool rapidly assesses the sediment plume dispersion based on the ambient hydrodynamic conditions. In the present version, the dredge plume dispersion module is based on the Delft3D-PART code, which is made available freely for use in this tool, but it can be replaced relatively easily by another dispersion model. Based on the sediment plume dispersion the expected stresses (suspended sediment concentration, resulting in light attenuation and sedimentation) are determined at the locations with sensitive ecosystems in the form of ‘time-series’ at these locations. Furthermore, the ‘footprint’ of the dredge plume is presented for further reference (Figure 1).
- The locations of the ecologically sensitive areas and species and the associated Species Response Curves for Seagrass and coral are included in a database in the tool (XML format, so it can easily be extended and edited). To be able to use the SRC in practical applications with the tool, it is mapped onto a discrete number of effect regimes, distinguishing different time scales and intensity levels. In the current version of the tool the ecological assessment of Van Doorn-Groen (2007) is used (see table below). This assessment method classifies effects on the basis of the excess stress above background conditions in (mg/l) and the duration of this stress in percentage of time. In the ecological assessment module of the tool, this assessment method indicates the ecologically sensitive areas and species. They are linked to the effect regimes to enable assessment in terms of ‘no effect’, a ‘sub-lethal’ or a ‘mortal effect’ for the different species, given the excess stress and its duration (also see figure below for a schematic presentation of the mapping of model results and species response curves to effect regimes).
- The expected effects on the ecologically sensitive areas and species will show up in green (ok), orange (sub-lethal) or red (mortal) on the map (also see the IDPT screen shot). For each of the timescales at which an effect is expected, more information (and possibly monitoring advice) is provided by clicking on the highlighted areas (markers) in the map.
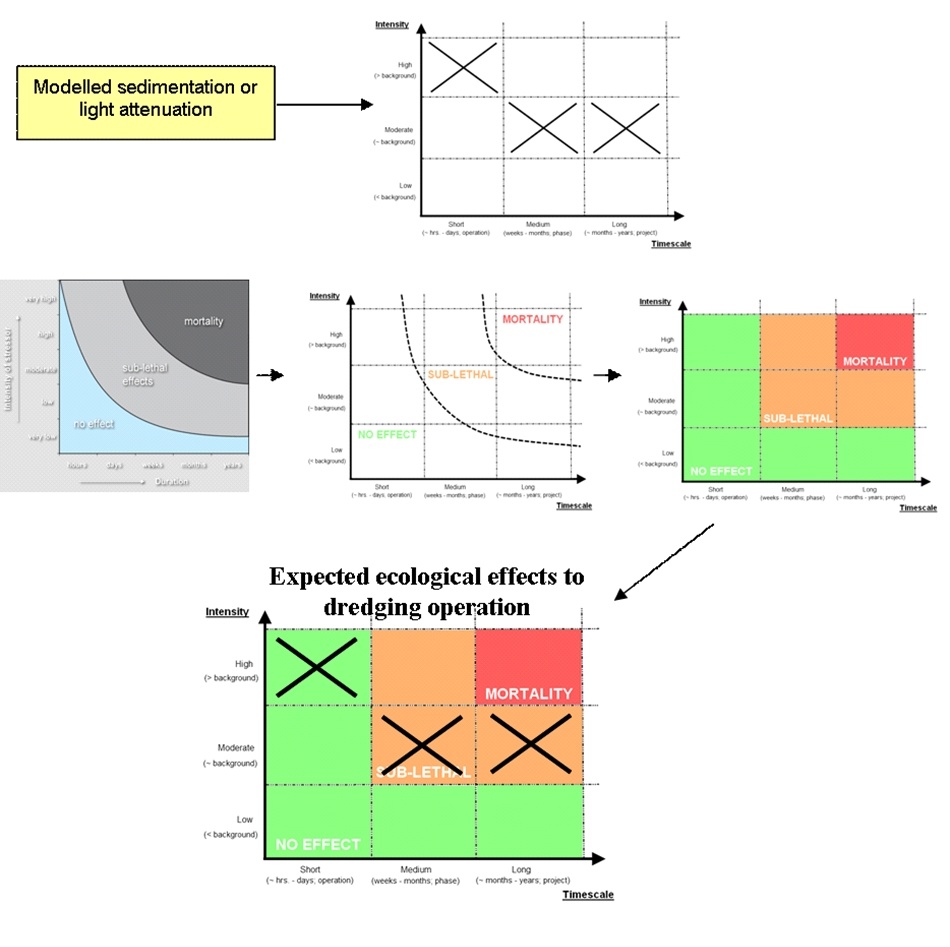
Mapping of model results and ecological species response curves to effect regimes
| Severity | Definition (excess concentration) (according to Van Doorn – Groen 2007) | Effect regimes IDPT |
|---|---|---|
| No Impact | Excess Suspended Sediment Concentration > 5 mg/l for less than 5% of the time | level 1 – no effect (green) |
| Slight Impact | Excess Suspended Sediment Concentration > 5 mg/l for less than 20% of the time Excess Suspended Sediment Concentration > 10 mg/l for less than 5% of the time | level 1 – no effect (green) |
| Minor Impact | Excess Suspended Sediment Concentration > 5 mg/l for more than 20% of the time Excess Suspended Sediment Concentration > 10 mg/l for less than 20% of the time | level 2 – sub-lethal effect (orange) |
| Moderate Impact | Excess Suspended Sediment Concentration > 10 mg/l for more than 20% of the time Excess Suspended Sediment Concentration > 25 mg/l for more than 5% of the time | level 2 – sub-lethal effect (orange) |
| Major Impact | Excess Suspended Sediment Concentration > 25 mg/l for more than 20% of the time Excess Suspended Sediment Concentration > 100 mg/l for more than 1% of the time | level 3 – mortality (red) |
4. Developing a case with the IDPT
The set-up of the IDPT is generic, such that this software can be used for any site or location. In the current research program of Building with Nature the tool has been applied to the Singapore coastal waters. Application at another location requires site-specific data, like:
- adaptation of the tool settings file, which includes settings regarding the geographical location of the tool application, references to the background conditions, model parameters, such as the dispersion coefficient, etc.
- an ecological database with species response curves and locations of vulnerable ecosystems or species;
- a database with ambient hydrodynamic conditions. These hydrodynamic data are in the present implementation based on Delft3D-FLOW modelling results. These hydrodynamic conditions can be prepared by running a Delft3D-FLOW model with the on-line WAQ coupling activated. For convenience, a switch to activate this option has been implemented in the Delft Dashboard tool, which could be used to set up an initial Delft3D-FLOW hydrodynamic model. For other use and more details, reference is made to the Delft3D-FLOW User Manual;
- a database with background sediment conditions (optional, if ecological criteria are used which include this).
The IDPT-code is easily adaptable by experienced Matlab users, because of its modular set-up. If desired, modules can be replaced or added to the workflow and the behaviour and appearance of the tool can be changed. This flexibility is used, for instance, when making dredging suitability maps (based on a maximum specified effect) instead of assessing the effects of a specific dredging operation
Advice and recommendations
Limitations
The IDPT is intended for rapid assessment of the effects of dredging activities on vulnerable coastal ecosystems. The first-order estimate of ecological effects it produces cannot replace more advanced analyses or detailed modelling. The usefulness of the results depends, among others, on the accuracy of the ecological database, the hydrodynamic and sediment background conditions and the dredge plume dispersion model. This means that the computed ecological effects need to be considered carefully, taking into account the possible uncertainty ranges associated with the complex nature of the chain of operations leading to the estimated ecological effects. Expert interpretation and explanation are essential for proper use.
Tips and Tricks
- The stand-alone version of the IDPT also contains scenario management. This means that different scenarios (e.g. dredging operations/specifications, background conditions, etc.) can be prepared and run. The IDPT allows for easy switching between (prepared) cases so that the impact of certain measures (e.g. different dredging strategy) can easily be demonstrated. The cases can also be stored and reloaded for later use, e.g. in a meeting with a client or stakeholders to discuss the work method and its implications.
- The stand-alone version of the IDPT allows the user to change the current settings (XML) file to adapt e.g. the simulation settings from the File menu. To activate these adapted settings, ‘Reload settings’ need to be selected also from the File menu. The settings used for a certain case are stored in the case file for consistency and reference, but only after (re-)running the case. Reloading the settings does not affect the completed cases.
- The dredging input pop-up screen contains a table for the different points in space of the dredging operation. The lines in this table can be moved up and down, as well as copied and deleted, to customise the envisaged dredging operation to the user’s needs without having to click each point in the Google Map. The dredging schedule can also be saved and loaded, so that even an off-line specification of the dredge track (e.g. in a text editor) can be used (possibly convenient if an actual dredging log file is used).
5. SWOT analysis
These lessons are derived from a workshop session on 22 December 2011 involving Ecoshape Partners. The overview has been updated on 1 March 2012 and 21 June 2012.
| Strengths | Weaknesses |
|---|---|
| Applicable to full cycle from source to effectTool usable as Operation-based AND Impact-based (Reverse cycle)Rapid-assessmentEasy visualization for communication purposesGeneric methodPredictions of impactModular and flexible set-upThe graphical output is understandable to a lay audienceTailor-made (site-specific databases)Insights into the ecosystem and its response | Limited accuracy (rapid-assessment tool)Difficult to validate full cycleSRC not completely generic (location & species specific)Time consuming to collect ecological dataFor each ‘new’ area a new database with ambient conditions need to be set-up using modelling |
| Opportunities | Threats |
| Standard method/approach (generic)Optimisation of the monitoring program (for adaptive management)Helps to create awarenessStimulates sharing knowledgeInteractiveCan be used to make the process operational and transparentEnables active stakeholder participationProvides information about ecosystemsInclusion of different types of criteria, e.g. ecological, institutional, operational, industrial, etc. | Garbage in = garbage out (use any model with care)Uncertainties in the far-field spreading of plumesUncertainties in physical parameters, such as the sediment characteristicsUncertainty propagation in the computational processOther stressors (natural or human-induced)A tool this comprehensive may create false expectationsDifficult to determine source term during dredging operation |
6. Lessons learned
Lessons Learned development process
- Keep stakeholders pro-actively informed, also if these stakeholders are not pro-actively involved to keep monitoring their requirements and if the product (i.e. IDPT tool) still meets these requirements.
- The use of a modular software design in a programming language that many development team members are familiar with, hugely expedites the development process, since modules can be developed in parallel.
- Making individual team members responsible for their own module development stimulates the involvement and motivation of the team members
Lessons Learned user experience
- Based on the comments gained during the Building with Nature conference, the attendees commented that they were impressed by the appearance and the possibilities of the prototype tool and found this development very interesting. Also the suitability map mode was found to be useful.
- In particular from a communication perspective, the tool is considered to be potentially very useful and powerful, specifically for communication with the community (e.g. living close to the project area, public). It was mentioned that the local community can have a very large influence on the progress of a construction project and a tool such as this could improve the communication with them substantially.
- It was also requested if such tool could be developed in a similar manner for other aspects, such as swimmer safety at the Sand Engine; and this is obviously possible in an efficient way based on the flexible framework that is developed in this project.
- The attendees quickly realised that the ‘weakest link’ in the tool would be the ecological criteria and assessment of the ecological effects, mainly fed by the ecological response data available (or actually not available).
- Some attendees had doubts about the applicability of rapid-assessment tools in general. The results of such tools generally provide an indication only, while in many cases more than just an indication is required. These cases require detailed modelling which is not rapid-assessment. Nevertheless, a rapid-assessment tool could also provide insight in the necessity of detailed modelling or other approaches in an early stage of the project design. It is noted however, that this prototype tool development should be regarded as a proof-of-concept and technique which could be used in many ways and for many applications in different dredging project phases and that it could be useful to support these phases in addition to more traditional approaches (and not so much replace other assessments or detailed modelling). In particular, during project execution and monitoring, this tool set-up, and the possibility to easily combine results with measurements in a Google Earth map environment, can be very useful.
Technical Lessons Learned
Lessons learned setting up a MapTable tool
- Setting up a database with unknown data requires a generic approach. Ecological data was not yet available at the start of the project. However, this did not impose any problems, due to the generic approach of the setup of the database.
- Using separate modules makes the backbone of the MapTable tool and the data transfer more generic. For instance, modules can be replaced in the future without adapting the backbone of the tool.
- Using separate modules makes it easier for people to work independently on the tool.
- Using settings files makes the MapTable tool easier adaptable.
Lessons learned Delft3D-PART – Dredge Plume Dispersion Modelling
- By using a closed boundary the particles will be reflected. In case of an open boundary the particles will leave the domain and never return. Therefore it is necessary to have a sufficiently large model domain to capture the full relevant extent of the plume;
- In the area of interest the grid size on which the Delft3D-PART results are projected should be small enough (e.g. <100-200 meter) to obtain a realistic value for the suspended sediment concentrations. It is noted that Delft3D-PART is a langrangian sub-grid model, but in order to derive the sediment concentrations, control volumes (i.e. a grid) is required. This grid can be the Delft3D-FLOW grid (by default) or a separately defined Delft3D-PART ‘zoom grid’;
- The concentration in an observation point is given as cell averaged of the grid cell it is in. If an observation point is located within the zoom grid, the output concentrations provided are the zoom grid cell averaged concentrations;
- The time scale of simulations is usually limited to a few weeks, in order to simulate accurately using a large number of particles;
- The number of particles needed for an accurate solution would be ideally 100 particles in one grid cell, implying a deviation of 1% (99% accuracy);
- If the bed shear stress at any location is greater than the critical shear stress for erosion, all deposited particles at that location will be returned in the water column instantaneously. This gives a ‘sudden’ plume which is not desired. Therefore it is advised to exclude erosion by choosing a high threshold for the critical shear stress for erosion;
- When using a large fall velocity there is an artefact in the module that the particles will ‘bounce’ at the bed and return in the water column, while they should stay at the bed. To reduce this difficulty all settings should be chosen realistically;
- Vertical dispersion is around 10^-3 m^2/s for low current velocities and a non-stratified model. In case of high current velocities the vertical dispersion can be increased to 10^-2 m^2/s. This value can be specified in the IDT settings file;
- Horizontal diffusion increases in about a day from 0.01 m^2/s to 1 m^2/s, depending of the size of the grid. At first the plume is concentrated, later on it will become larger with as consequence more horizontal diffusion.