Practical Applications
The practical application of the IDPT tool will be explained with a case study from Singapore:
- Introduction to the case study Singapore
- Study site
- Reclamation and dredging methods
- Schematisation of the sediment source terms using TASS
- Schematisation of dredging operations and site conditions
- Description of hydrodynamic models and tests
- Evaluation of IDPT results
- Lessons learned
1. Introduction to the case study Singapore
The objective of the IDPT Showcase is to demonstrate how the Interactive Dredge Planning Tool can be used to assess ecological responses to dredging operations (sediment plumes and sedimentation) in a specific dredging project. A fictitious dredging project in Singapore is described, including dredging scenarios and source term modeling. This showcase yields lessons learned on the tool and shows users how to apply this tool. The ecological results and their reliability are not further assessed and interpreted.
The showcase presents an initial assessment of the response of sensitive species to turbidity and sedimentation, starting from a basic background hydrodynamic model. This configuration improves with time, analogous to the situation in a real dredging project, where information is initially limited but progressively improves as the project develops.
Within the Singapore case, the East Coast Park (ECP) has been selected as a location for the fictitious dredging project. Sediment plumes cause by a Trailing Suction Hopper Dredger (TSHD) operation are assessed by using the Turbidity ASsessment Software (TASS). The resulting sediment source terms are subsequently used as input to IDPT. The results of IDPT give an indication of the response of coral and seagrass ecosystems in the vicinity to dredging-induced suspended sediment and sedimentation.
The following aspects are considered within this showcase:
- Selection of the area of interest.
- Selection of dredging and reclamation work method.
- Schematisation of dredging operations and site conditions.
- Schematisation of the sediment source term with the TASS model.
- Hydrodynamic model set up. Study of available background information and data sets (e.g. bathymetry and tidal datasets); extension and upgrading (resolution) of models, etc.
- Evaluation of results and lessons learned
2. Study site Southern Islands region and ECP
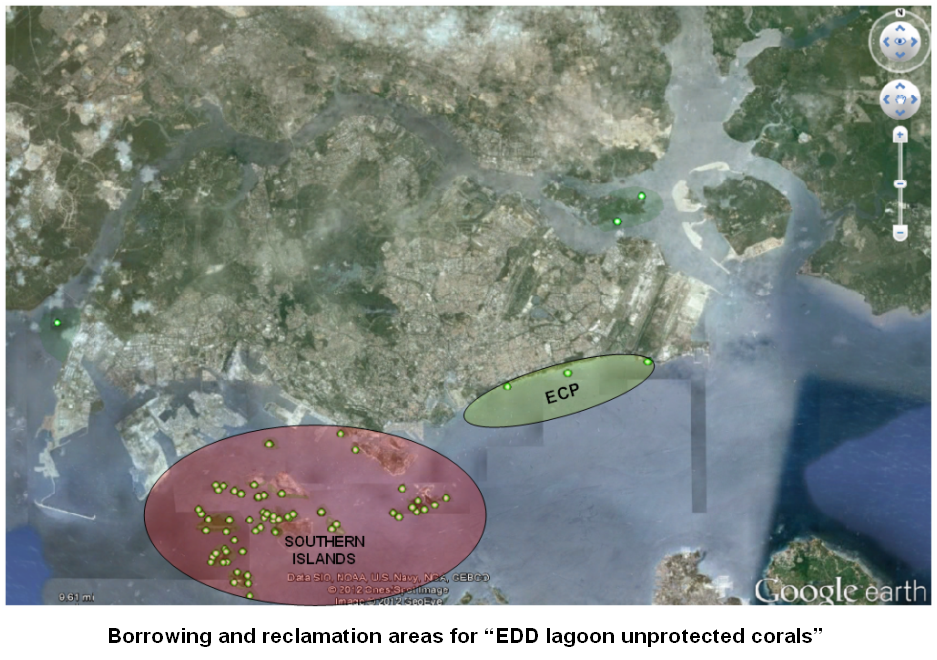
The showcase concerns fictitious land reclamation in East Coast Park (ECP). For this area the BwN innovation program has developed the EDD design pilot ECP. This design was used to define the reclamation project. For the sake of argument, the sand for this reclamation is assumed to be found in the Southern Islands region in Singapore, because this is the area with the most sensitive receptors.
East Coast Park (ECP) is the result of various reclamation projects since the 1970’s on the coast of Katong (Southern Singapore) and extending from Changi to Tanjong Rhu. Today, East Coast Park is the largest park in Singapore, fully built on reclaimed area. Due to wave action, lack of sediment supply, and presumably sea level rise, ECP has been reported to experience coastal erosion, causing beachfront areas to collapse.
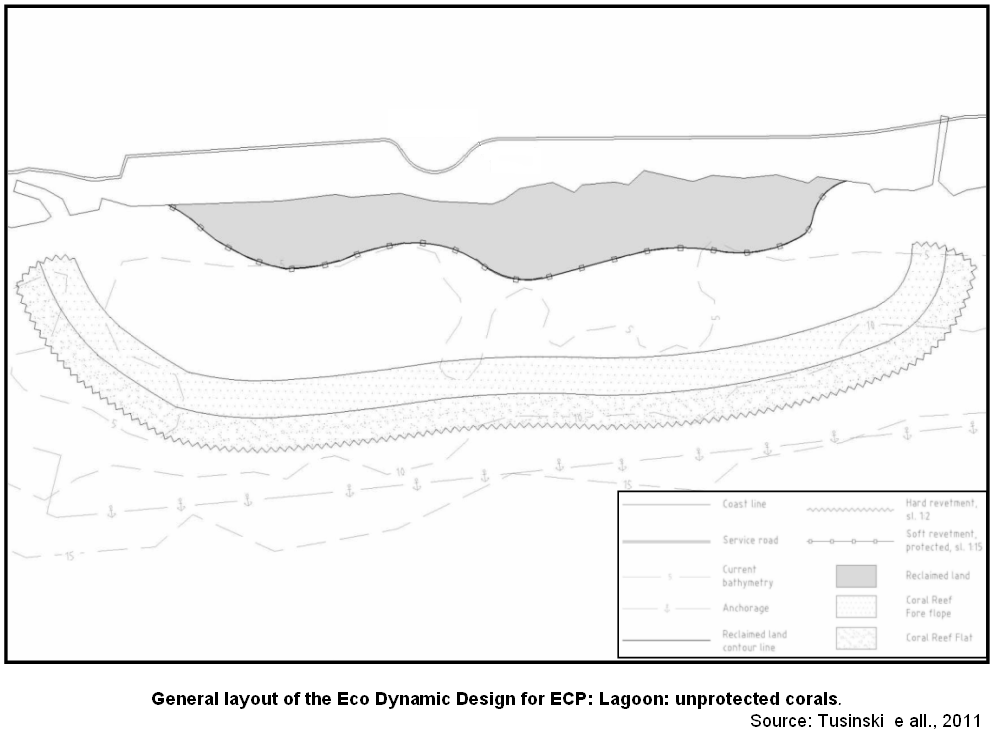
The BwN-design selected for the showcase is the “Lagoon, unprotected corals [1]” variant, the. The purpose of the reclamation project is to create additional land for recreational purposes while favouring the development of local habitats.
The design involves a seaward extension of the existing land and the construction of a hard substrate to enables coral reef formation (see Figure). The hard substrate in shallow water should favour coral colonization; the ridge allows reducing the amount of landfill (perched beach).
3. Reclamation and dredging methods
Although in reality landfill material is scarce in the Singapore area, we assume for the sake of argument that the borrow area for landfill material for the ECP is located in the Southern Island region. This area is rich in coral and seagrass and therefore suitable to investigate the effect of dredging plumes on this ecosystem.
The dredge parameters used are fictitious and not necessarily valid in practice.
The dredging and reclamation works for this showcase include:
- Dredging of soil by means of a TSHD;
- Bunding the reclamation area;
- Pumping of dredged material into the bunded reclamation area (by means of a discharge pipeline);
- Control of dewatering discharges using bunded settling basins.
The required volume of dredged material is 8.5 million cubic meters. It is hereby assumed that all the dredged material is suitable for reclamation purposes. Therefore, the approximate output per dredger of 5.400 m3 in a dredging cycle of 6.2 hours will be 16.200 m3/day, assuming 3 dredging cycles daily. The total time for completing the dredging works will be 8-9 months
_____________________
[1]This design has been prepared as part of the multidisciplinary work “Developing an eco-dynamic design for additional land in front of East Coast Park, Singapore” as part of the Building with Nature Singapore project (Innovative coastal protection).
4. Schematisation of sediment source term
The source term which is determined here is the source for the far field plume, which may serve as input for dispersion modelling. As mentioned before, the borrow area for the ECP reclamation works is fictitious. Correspondingly, the sediment properties are specific for this study and should not be considered as a reference for sediment properties in other studies in this area.
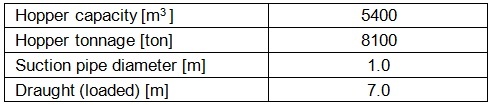
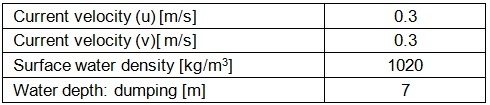
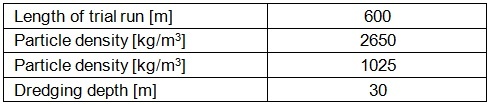
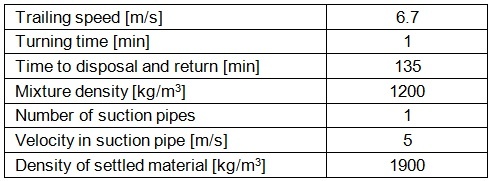
TASS software was used to model the source term for overflow and dynamic plumes from the TSHD. Initial TSHD dimensioning and operating characteristics, site conditions and in-situ sediment characteristics are required as inputs.
The TASS Overflow Model computes the overflow sediment loss from the hopper in each time step of the model run and for each sediment fraction. The output is used to compute the dynamic plume, which is used as input (source term) to the IDPT. Parameter settings can be found in the tables alongside, the source term is given in the figure.
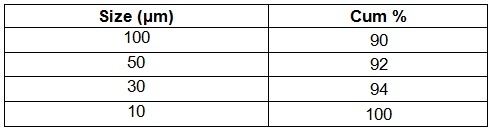
The percentage of fines in the overflow amounts to 10%. In the computation the fine and the course sediment fractions were lumped, respectively, yielding to binary grain-size distribution, with a fine fraction (particle size up to 50 µm) and coarse fraction (particle size from 50 µm to 100 µm).
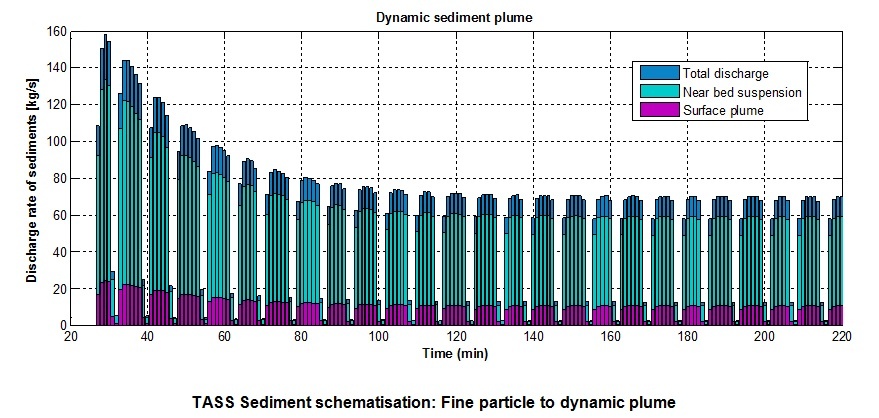
The TASS Dynamic Model computes the fate of the (near-field) plume and the rate of fine sediment release from the plume. The model calculates separately the sediment flux from the dynamic plume into suspension near the bed (density current) and in the water column (dilute suspension) and the sedimentation on the bed.
For the sediment source computation of the IDPT-showcase the flux into the near-bed density current and into the dilute suspension are used. The sediment source term resulting from the TASS model is shown in the diagram.
5. Schematisation of dredging operations and site conditions
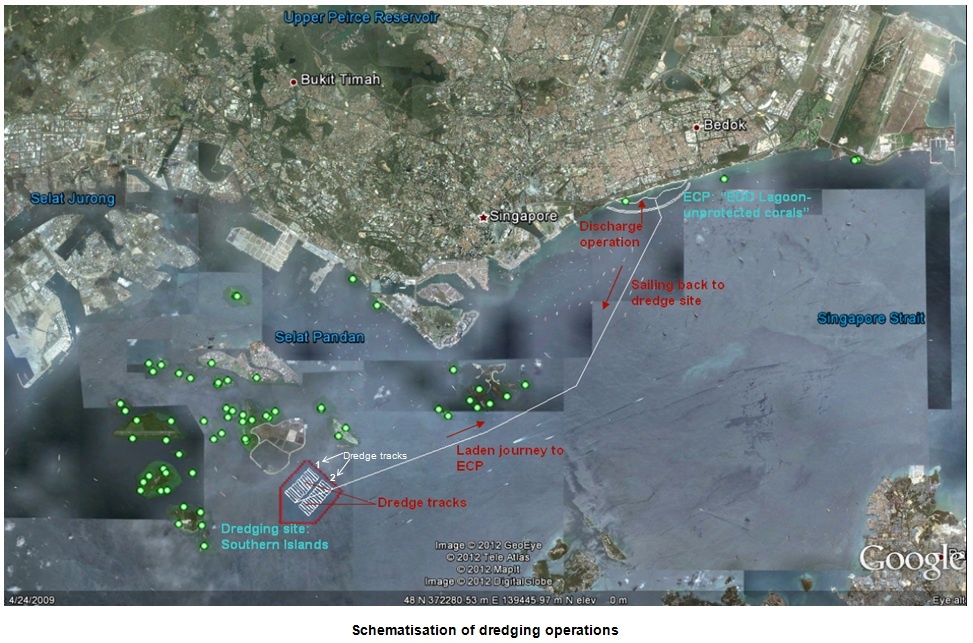
The figure above schematically shows the dredging operations, between sand sourcing in the area of Southern Islands and the reclamation area near East Coast Park. The dredging scenario consists of five different phases, each with its own input into the IDPT. These five phases are:
- Loading of the TSHD until the overflow level is reached.
- Loading of the TSDH until maximum permissible load is attained while discharging sediment-laden overflow.
- Loaded journey of the TSHD from dredging area to reclamation area.
- Discharge operation at the reclamation area.
- Sailing back empty to dredging site (Southern Island).
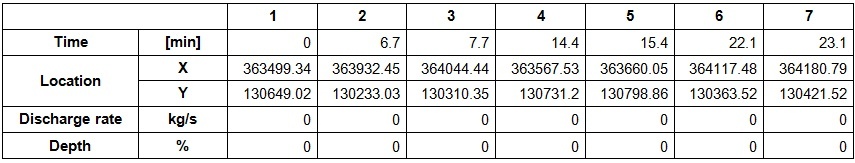
1 Loading of TSHD until the overflow level is reached
The overflow level is reached after 27 minutes of dredging. The table shows the input for the IDPT as long as there is no overflow discharge.
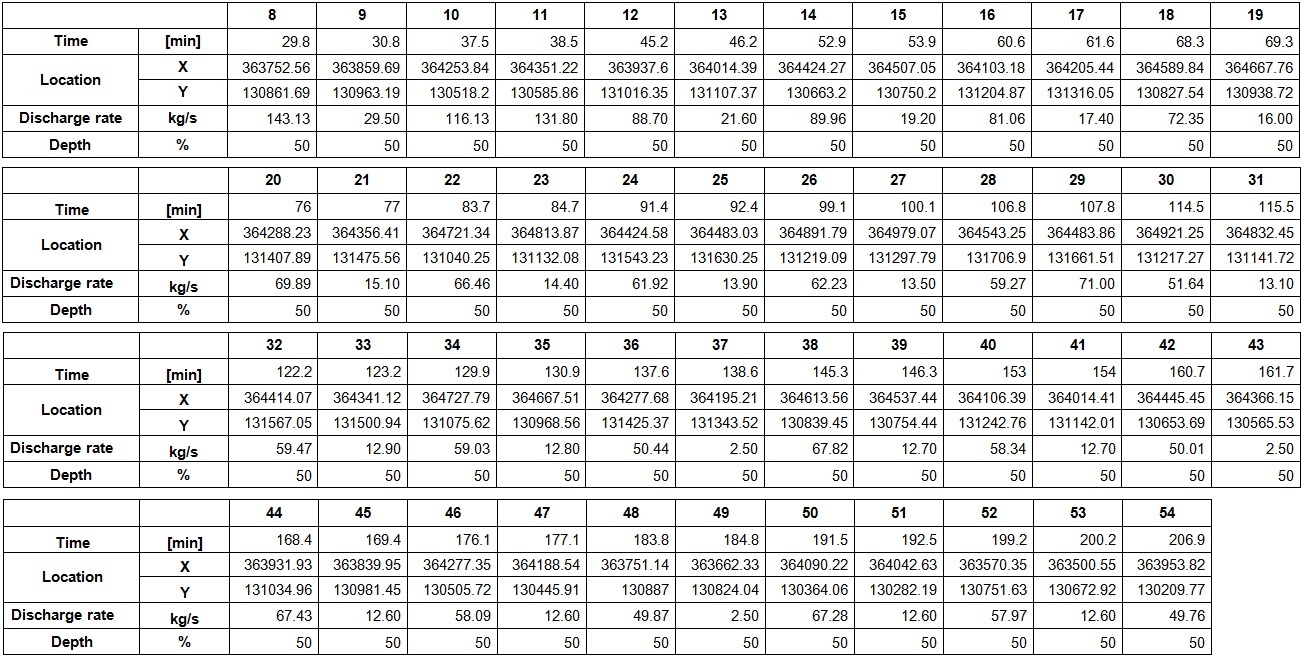
2 Loading of TSHD until maximum permissible load is attained while discharging sediment-laden overflow
From the moment that the overflow level is exceeded until the maximum TSHD’s tonnage is reached, sediment-laden overflow will be released into the water column. The maximum load is reached 180 minutes later after the overflow level is exceeded (27 minutes from start). The sediment fluxes into the near-bed density current and the dilute suspension in the water column are used to calculate the depth-averaged discharge rate (see table for the IDPT input in this phase).
3 Loading journey of TSHD to reclamation site (ECP)
The travelling time from the dredging site to ECP is assumed to take approximately 72 minutes, assuming a laden vessel speed of 13 knots and a vessel speed approaching the coastline of ECP of 3 knots. During this period no overflow is assumed.
4 Discharge operation
Discharging the sediment from the TSHD in the reclamation area will take approximately 30 minutes, assuming a discharge rate of 3.18 m3/s.
5 Sailing back to dredging site
The travelling time from ECP to the Southern Islands borrowing area is approximately 65 minutes, assuming an average sailing speed of 14 knots.
6. Description of hydrodynamic models and tests
When incorporating the hydrodynamic forcing and the species response indicators into the model, several factors need to be taken into consideration, such as:
- the sediment characteristics in the borrow and reclamation areas;
- the use of a certain bathymetry dataset;
- the definition of the model domain and resolution (e.g. by selecting an specific grid size and/or grid resolution), and
- the definition of indicators and criteria of the ecological response.
These factors are crucial to the accuracy of the IDPT results.
Three nested hydrodynamic models (different in model domain and resolution, bathymetry, background suspended sediment concentration) were implemented and tested. The largest-scale model was obtained from Deltares; it uses the Singapore Regional Model SRM with detail in the Johor Estuary. The second model and third model were built using Delft Dashboard, which enables generating a model from available on-line data such as bathymetry and tidal datasets. It also facilitates a quick schematisation of the model by using tools to create and modify the model grid, to nest different models or to create domain decompositions. Tidal stations from on-line data bases can also be used to create Time-series of model results can be obtained in preset stations, in order to compare them with on-line tidal data, for instance. This sequence of models is used as a background hydrodynamic model for IDPT to predict the dispersion of the dredging plume.
Critical factors for the hydrodynamic model configuration are:
Model domain: important to accurately include the relevant large scale phenomena in the region, such as tidal forcing. For the Singapore region, the model domain needs to include the transition between the dominantly diurnal tidal regime from the South China Sea and the semi-diurnal regime from the Indian Ocean.
Grid resolution: determined according to the required detail of output data; nesting of models can be used for efficiency reasons.
Bathymetry: implementation of detailed bathymetry data may increase the accuracy of the simulations, but may also induce additional computational time.
Tidal forcing: tidal models are available to be incorporated via Delft Dashboard; the tidal stations in these models are used as observation stations.
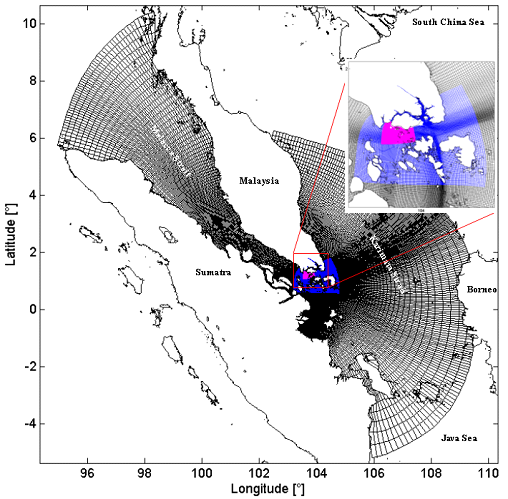
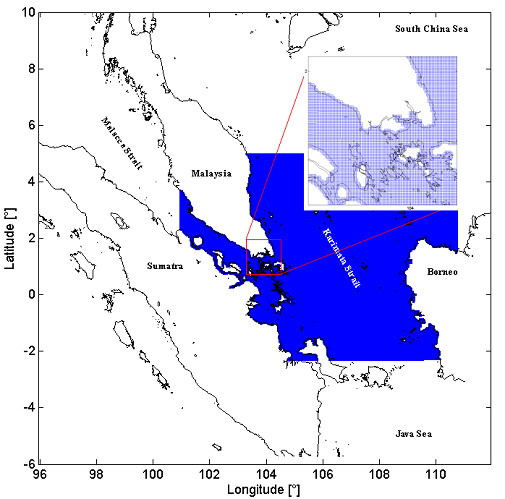
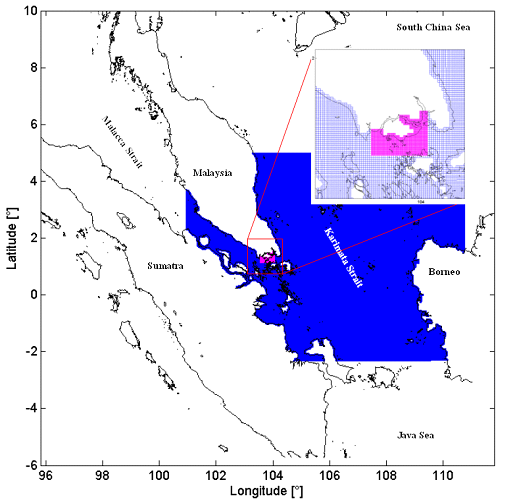
| Model 1: Singapore Regional Model SRM Grid Johor Estuary | Model 2. A 2D hydrodynamic model configured in Delft Dashboard. Large grid covering the area of the Malacca and Karimata Straits | Model 3: A 2D hydrodynamic model, inner fine grid size within prior large model configured in Delft Dashboard. |
| Grid size: Outer (black): Curvilinear grid. Average grid size: 3.7 km by 1.8 km Middle (red): Curvilinear grid. Average grid size: 470 m by 450 m Islands (blue): Curvilinear grid. Average grid size: 420 m by 150 m Bathymetry database: Deltares source. Tidal forcing database: Deltares source. | Grid size: Rectangular grid. 2 km Bathymetry database: GEBCO_08 Tidal forcing database: TPXO 7.2 | Grid size: Outer (blue): Rectangular grid size. 2 km Inner (red): Rectangular grid. 500 m Bathymetry database: GEBCO_08 Tidal forcing database: TPXO 7.2 |
 |  |  |
7. Evaluation of IDPT results
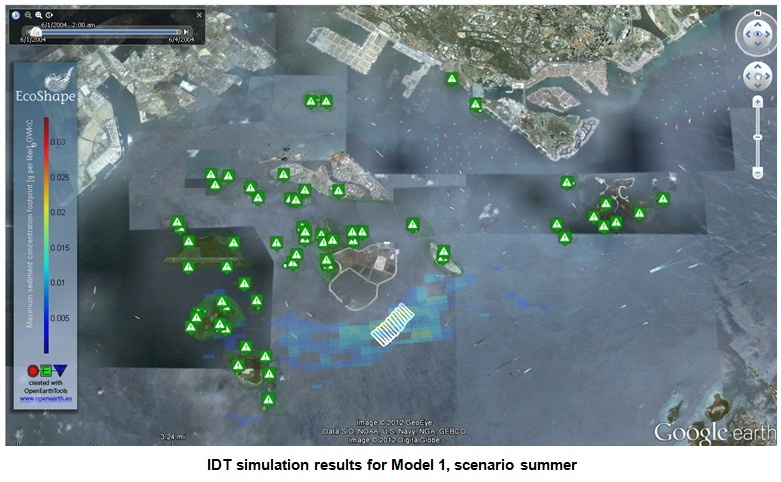
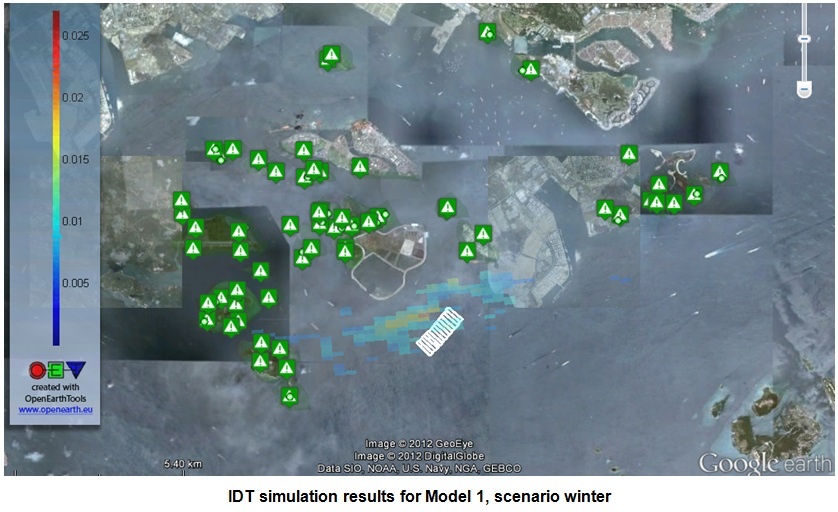
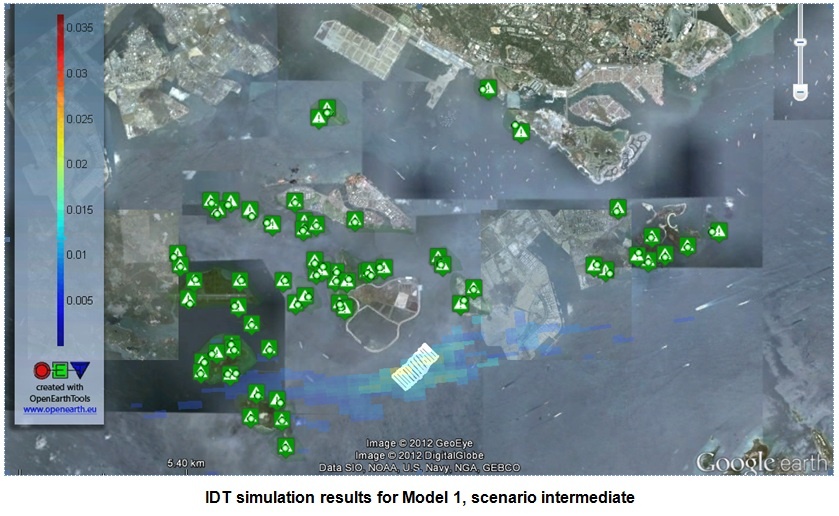
The three different models presented in ‘Models & Tests’ are run with the dredging scenario described before. The results of these simulations on the ecology are shown in the figures. Within the IDPT three different ambient hydrodynamic conditions are available: summer period including an East residual current, winter period including a West residual current and the intermediate period where there is no residual current.
Model 1: Singapore Regional Model SRM. Grid Johor Estuary (Source: Deltares)
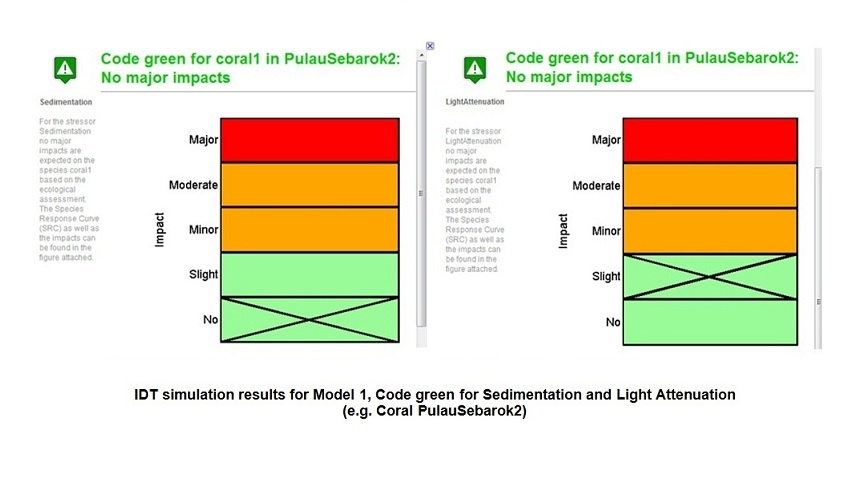
This model computes the large-scale hydrodynamics in three different periods (summer, winter and intermediate). The first scenario, summer, is presented in the top figure. For the three periods, neither of the stressors, light attenuation and sedimentation, has any significant effect on either the coral or the seagrass. For every station the Code green indicates that dredging activities under the given conditions do not increase the concentration of suspended sediments in the water to a dangerous level. At most a slight impact is expected as a result of the dredging-induced turbidity. A maximum value of 0.022 g/l occurs in winter in the southern part near dredge track 2.
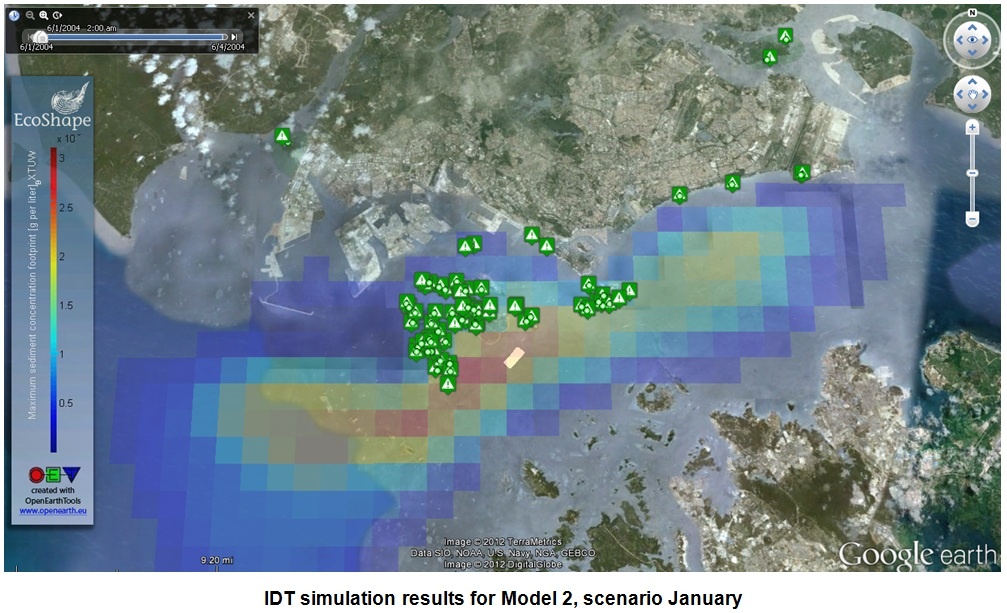
Model 2: Configured in Delft Dashboard; large grid covering the area of the Malacca and Karimata Straits
This model was setup using Delft Dashboard to simulate a month of TSHD discharges during the summer period. The results shown in the figure are maximum values of suspended sediment concentrations in each grid cell (2 km2). Note that the scale of sediment concentrations was adjusted in order to visualise differences between the values in the area of interest. The red-coloured grids show a maximum concentration of 0.026 mg/l (scale is x10^-5 g/l). These suspended sediment concentrations are too low to have a significant effect on the Southern Islands ecosystem. There is a possibility, however, that this is a model artefact associated with the configuration of the particle tracking component (PART) of Delft3D.
Model 3: Nested model (Delft Dashboard); inner fine grid covering the Singapore area
In order to improve the results of the previous models, a nested model was built with detail in the area of the Southern Islands. The grid size was refined by a factor four. At the time of writing, however, this model required further examination of the hydrodynamic boundary conditions derived from Model 2 and the nesting process.
Analysis of results
The results of Model 1 (SRM Grid Johor Estuary) show that there is a well-defined control volume in Delft3D-PART for each computational grid. This may be the result of the relatively small grid size of the model at the Southern Islands location, when compared with the large grid of Model 2. Results of IDPT for Model 2 could be improved modifying the amount of available particles to be eroded for each computational grid in Delft3D PART.
The bathymetry dataset used in Model 1 is unknown, whereas for Model 2 and Model 3 GEBCO_08 was used (with a resolution of 30 arc-seconds). When preparing a hydrodynamic model for IDPT different bathymetric datasets can be used. Depending on model domain and resolution, the results may differ.
8. Lessons learned
- Creating a model grid with Delft Dashboard may seem relatively easy, but it requires a basic understanding of the relevant large-scale processes. In Singapore Strait flow velocities are strongly influenced by non-tidal processes such as local winds and they are sensitive to changes in depth and the presence of embayment or islands. This means that a large model is needed.
- A model with many grid points produces large result-files which take a long time to be read into and processed in IDPT and PART. It is therefore recommendable to use the nesting function within Delft Dashboard or Delft3D to define a smaller-scale model that includes the hydrodynamics of the larger-scale model. This will reduce the time required to obtain results from IDPT.
- When computing the sediment source terms with TASS, the model can be used in a dynamic (depth-resolving) or a passive (depth-averaged) mode. The dynamic mode produces produces more conservative estimates of the sediment fluxes into the near-bed density current and the dilute suspension than the passive mode.
- The passive plume source term is difficult to estimate, because TASS-results are given in therms of depth-averaged SSC and not terms of sediment fluxes. Hence they include the effects of the ambient conditions and the operability of the TSHD.